Experian 2011 Annual Report Download - page 116
Download and view the complete annual report
Please find page 116 of the 2011 Experian annual report below. You can navigate through the pages in the report by either clicking on the pages listed below, or by using the keyword search tool below to find specific information within the annual report.-
 1
1 -
2
-
3
-
4
-
5
-
6
-
7
-
8
-
9
-
10
-
11
-
12
-
13
-
14
-
15
-
16
-
17
-
18
-
19
-
20
-
21
-
22
-
23
-
24
-
25
-
26
-
27
-
28
-
29
-
30
-
31
-
32
-
33
-
34
-
35
-
36
-
37
-
38
-
39
-
40
-
41
-
42
-
43
-
44
-
45
-
46
-
47
-
48
-
49
-
50
-
51
-
52
-
53
-
54
-
55
-
56
-
57
-
58
-
59
-
60
-
61
-
62
-
63
-
64
-
65
-
66
-
67
-
68
-
69
-
70
-
71
-
72
-
73
-
74
-
75
-
76
-
77
-
78
-
79
-
80
-
81
-
82
-
83
-
84
-
85
-
86
-
87
-
88
-
89
-
90
-
91
-
92
-
93
-
94
-
95
-
96
-
97
-
98
-
99
-
100
-
101
-
102
-
103
-
104
-
105
-
 106
106 -
 107
107 -
 108
108 -
 109
109 -
 110
110 -
 111
111 -
 112
112 -
 113
113 -
 114
114 -
 115
115 -
 116
116 -
 117
117 -
 118
118 -
 119
119 -
 120
120 -
 121
121 -
 122
122 -
 123
123 -
 124
124 -
 125
125 -
 126
126 -
127
-
128
-
129
-
130
-
131
-
132
-
133
-
134
-
135
-
136
-
137
-
138
-
139
-
140
-
141
-
142
-
143
-
144
-
145
-
146
-
147
-
148
-
149
-
150
-
151
-
152
-
153
-
154
-
155
-
156
-
157
-
158
-
159
-
160
-
161
-
162
-
163
-
164
 |
 |

114 Experian Annual Report 2011
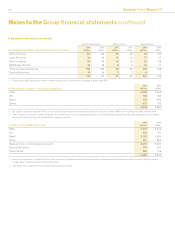
Notes to the Group nancial statements continued
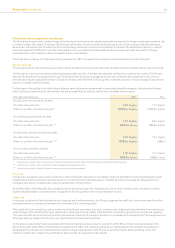
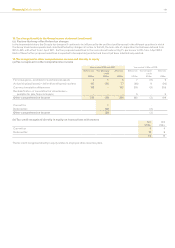
10. Foreign currency
The principal exchange rates used in these nancial statements are as follows:
Average Closing
2011 2010 2011 2010 2009
Sterling : US dollar 1.55 1.58 1.60 1.52 1.43
US dollar : Brazilian real 1.73 1.88 1.63 1.79 2.30
Euro : US dollar 1.32 1.41 1.42 1.35 1.33
An indication of the sensitivity of the Group’s results to foreign exchange risk is given in note 8.
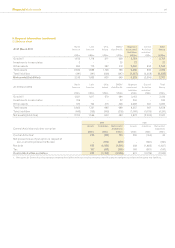
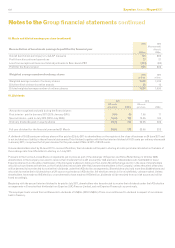
11. Total operating expenses
(a) Labour costs
Notes 2011
US$m
2010
(Re-presented)
(Note 3)
US$m
Wages and salaries 1,146 1,138
Social security costs 167 165
Share-based payments 33 64 63
Pension (income)/costs - dened benet plans 34 (19) 10
Pension costs - dened contribution plans 37 34
Employee benet costs 1,395 1,410
Other labour costs 130 104
1,525 1,514
Wages and salaries for the year ended 31 March 2010 have been restated to exclude external payments of US$20m which are of a marketing
nature and which are now reported within marketing and customer acquisition costs. Other labour costs include costs in respect of external
contractors, outsourcing costs and costs relating to the recruitment, development and training of employees. The denition, and analysis of the
remuneration, of key management personnel is given in note 45.
(b) Depreciation and amortisation 2011
US$m
2010
US$m
Depreciation of property, plant and equipment 81 85
Amortisation of intangible assets 336 329
Write down on disposal of property, plant and equipment and intangibles 3 3
420 417
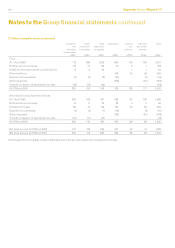
(c) Fees payable to the Company’s auditor 2011
US$m
2010
US$m
Audit and assurance services:
Audit of the parent company and Group nancial statements 1 1
Audit of the nancial statements of the Group’s subsidiaries, pursuant to legislation 3 3
Other assurance services, including the review of the Group’s half-yearly nancial report - 1
4 5
Other services:
Taxation services 3 4
Total fees payable to the Company’s auditor and its associates 7 9
The guidelines covering the use of the Company’s auditor for non-audit services are set out in the corporate governance statement. Fees
payable to the Company’s auditor are included within other operating charges.