Energy Transfer 2015 Annual Report Download - page 13
Download and view the complete annual report
Please find page 13 of the 2015 Energy Transfer annual report below. You can navigate through the pages in the report by either clicking on the pages listed below, or by using the keyword search tool below to find specific information within the annual report.-
 1
1 -
2
-
 3
3 -
 4
4 -
 5
5 -
 6
6 -
 7
7 -
 8
8 -
 9
9 -
 10
10 -
 11
11 -
 12
12 -
 13
13 -
 14
14 -
 15
15 -
 16
16 -
 17
17 -
 18
18 -
 19
19 -
 20
20 -
 21
21 -
 22
22 -
 23
23 -
24
-
25
-
26
-
27
-
28
-
29
-
30
-
31
-
32
-
33
-
34
-
35
-
36
-
37
-
38
-
39
-
40
-
41
-
42
-
43
-
44
-
45
-
46
-
47
-
48
-
49
-
50
-
51
-
52
-
53
-
54
-
55
-
56
-
57
-
58
-
59
-
60
-
61
-
62
-
63
-
64
-
65
-
66
-
67
-
68
-
69
-
70
-
71
-
72
-
73
-
74
-
75
-
76
-
77
-
78
-
79
-
80
-
81
-
82
-
83
-
84
-
85
-
86
-
87
-
88
-
89
-
90
-
91
-
92
-
93
-
94
-
95
-
96
-
97
-
98
-
99
-
100
-
101
-
102
-
103
-
104
-
105
-
106
-
107
-
108
-
109
-
110
-
111
-
112
-
113
-
114
-
115
-
116
-
117
-
118
-
119
-
120
-
121
-
122
-
123
-
124
-
125
-
126
-
127
-
128
-
129
-
130
-
131
-
132
-
133
-
134
-
135
-
136
-
137
-
138
-
139
-
140
-
141
-
142
-
143
-
144
-
145
-
146
-
147
-
148
-
149
-
150
-
151
-
152
-
153
-
154
-
155
-
156
-
157
-
158
-
159
-
160
-
161
-
162
-
163
-
164
-
165
-
166
-
167
-
168
-
169
-
170
-
171
-
172
-
173
-
174
-
175
-
176
-
177
-
178
-
179
-
180
-
181
-
182
-
183
-
184
-
185
-
186
-
187
-
188
-
189
-
190
-
191
-
192
-
193
-
194
-
195
-
196
-
197
-
198
-
199
-
200
-
201
-
202
-
203
-
204
-
205
-
206
-
207
-
208
-
209
-
210
-
211
-
212
-
213
-
214
-
215
-
216
-
217
-
218
-
219
-
220
-
221
-
222
-
223
-
224
-
225
-
226
-
227
-
228
-
229
-
230
-
231
-
232
-
233
-
234
-
235
-
236
-
237
-
238
-
239
-
240
-
241
-
242
-
243
-
244
-
245
-
246
-
247
-
248
-
249
-
250
-
251
-
252
-
253
-
254
-
255
-
256
-
257
 |
 |

Table of Contents
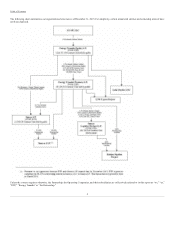
Investment in Sunoco Logistics Segment
The Partnership’s interests in Sunoco Logistics consist of 67.1 million Sunoco Logistics common units and 9.4 million Sunoco Logistics Class B Units,
collectively representing 27.5% of the limited partner interests in Sunoco Logistics as of December 31, 2015. The Partnership also owns a 99.9% interest in
Sunoco Partners LLC, the entity that owns the general partner interest and IDRs in Sunoco Logistics. Because the Partnership controls Sunoco Logistics
through its ownership of the general partner, the operations of Sunoco Logistics are consolidated into the Partnership. These operations are reflected by the
Partnership in the investment in Sunoco Logistics segment.
Sunoco Logistics owns and operates a logistics business, consisting of a geographically diverse portfolio of complementary pipeline, terminalling, and
acquisition and marketing assets that are used to facilitate the purchase and sale of crude oil, NGLs and refined products primarily in the northeast, midwest
and southwest regions of the United States. In addition, Sunoco Logistics owns interests in several product pipeline joint ventures.
Sunoco Logistics’ crude oil operations provides transportation, terminalling and acquisition and marketing services to crude oil markets throughout the
southwest, midwest and northeastern United States. Included within the operations are approximately 5,900 miles of crude oil trunk and gathering pipelines
in the southwest and midwest United States and equity ownership interests in three crude oil pipelines. Sunoco Logistics’ crude oil terminalling services
operate with an aggregate storage capacity of approximately 28 million barrels, including approximately 24 million barrels at its Gulf Coast terminal in
Nederland, Texas and approximately 3 million barrels at its Fort Mifflin terminal complex in Pennsylvania. Sunoco Logistics’ crude oil acquisition and
marketing activities utilize its pipeline and terminal assets, its proprietary fleet crude oil tractor trailers and truck unloading facilities, as well as third-party
assets, to service crude oil markets principally in the mid-continent United States.
Sunoco Logistics’ NGLs operations transports, stores, and executes acquisition and marketing activities utilizing a complementary network of pipelines,
storage and blending facilities, and strategic off-take locations that provide access to multiple NGLs markets. The operations contain approximately 900
miles of NGLs pipelines, primarily related to its Mariner systems located in the northeast and southwest United States. Terminalling services are facilitated by
approximately 5 million barrels of NGLs storage capacity, including approximately 1 million barrels of storage at its Nederland, Texas terminal facility and 3
million barrels at its Marcus Hook, Pennsylvania terminal facility (the “Marcus Hook Industrial Complex”). These operations also carry out Sunoco
Logistics’ NGLs blending activities, including utilizing its patented butane blending technology.
Sunoco Logistics’ refined products operations provides transportation and terminalling services, through the use of approximately 1,800 miles of refined
products pipelines and approximately 40 active refined products marketing terminals. Sunoco Logistics’ marketing terminals are located primarily in the
northeast, midwest and southeast United States, with approximately 8 million barrels of refined products storage capacity. Sunoco Logistics’ refined products
operations includes its Eagle Point facility in New Jersey, which has approximately 6 million barrels of refined products storage capacity. The operations also
include Sunoco Logistics’ equity ownership interests in four refined products pipeline companies. The operations also perform terminalling activities at
Sunoco Logistics’ Marcus Hook Industrial Complex. Sunoco Logistics’ refined products operations utilize its integrated pipeline and terminalling assets, as
well as acquisition and marketing activities, to service refined products markets in several regions in the United States.
Retail Marketing Segment
Our retail marketing business is conducted through our wholly-owned subsidiary, Sunoco, Inc. Our retail marketing operations include the sales of motor fuel
(gasoline and diesel) and merchandise at company-operated retail locations and branded convenience stores conducted in 14 states, primarily on the east
coast and south regions of the United States.
We also currently own a 68.42% membership interest in Sunoco, LLC, which distributes approximately 5.3 billion gallons per year of motor fuel to customers
in the east, midwest and southwest regions of the United States. The remaining 31.58% membership interest in Sunoco, LLC is held by Sunoco LP. Sunoco
LP also owns 50.1% of the voting interests in Sunoco, LLC; therefore, we do not have a controlling interest in Sunoco, LLC and account for our investment
under the equity method.
As discussed above, ETP expects to contribute to Sunoco LP the remaining 68.42% interest in Sunoco, LLC and 100% interest in the legacy Sunoco, Inc.
retail business for $2.23 billion. Sunoco LP will pay ETP $2.03 billion in cash, subject to certain working capital adjustments, and will issue to ETP
5.7 million Sunoco LP common units. The transaction will be effective January 1, 2016 and is expected to close in March 2016.
Our retail marketing segment also currently owns 37.8 million Sunoco LP common units, which we account for under the equity method. Sunoco LP is a
master limited partnership that operates more than 850 convenience stores and retail fuel sites and distributes motor fuel to convenience stores, independent
dealers, commercial customers and distributors located in 30 states at
7