Dell 1998 Annual Report Download - page 17
Download and view the complete annual report
Please find page 17 of the 1998 Dell annual report below. You can navigate through the pages in the report by either clicking on the pages listed below, or by using the keyword search tool below to find specific information within the annual report.-
 1
1 -
2
-
3
-
4
-
5
-
6
-
 7
7 -
 8
8 -
 9
9 -
 10
10 -
 11
11 -
 12
12 -
 13
13 -
 14
14 -
 15
15 -
 16
16 -
 17
17 -
 18
18 -
 19
19 -
 20
20 -
 21
21 -
 22
22 -
 23
23 -
 24
24 -
 25
25 -
 26
26 -
 27
27 -
28
-
29
-
30
-
31
-
32
-
33
-
34
-
35
-
36
-
37
-
38
-
39
-
40
-
41
-
42
-
43
-
44
-
45
-
46
-
47
-
48
-
49
-
50
 |
 |
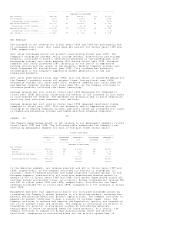
----------- ---------- ----------- ---------- -----------
(DOLLARS IN MILLIONS)
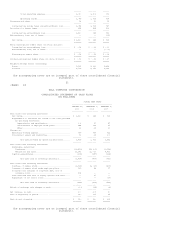
Net revenue....................... $18,243 48% $12,327 59% $7,759
Gross margin...................... 4,106 51 2,722 63 1,666
Percentage of net revenue....... 22.5% 22.1% 21.5%
Operating expenses................ $ 2,060 47 $ 1,406 48 $ 952
Percentage of net revenue....... 11.3% 11.4% 12.3%
Operating income.................. $ 2,046 56 $ 1,316 84 $ 714
Percentage of net revenue....... 11.2% 10.7% 9.2%
Net income........................ $ 1,460 55 $ 944 83 $ 518
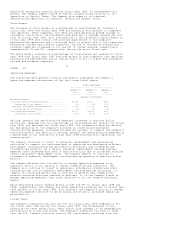
Net Revenue
The increase in net revenue for fiscal years 1999 and 1998 was principally due
to increased units sold. Unit sales grew 64% and 60% for fiscal years 1999 and
1998, respectively.
Unit sales increased across all product lines during fiscal year 1999. The
Company's enterprise systems, which include servers, workstations and storage
products, continued to build a substantial presence in the marketplace, with
enterprise systems unit sales growing 130% during fiscal year 1999. Notebook
computer unit sales increased 108%, primarily as the result of aggressive
pricing actions and the launch of new products. Desktop computer systems unit
sales increased 55% during fiscal year 1999. This increase was primarily
attributable to the Company's aggressive market penetration of new and
higher-end products.
Unit sales grew during fiscal year 1998, also the result of increased demand for
the Company's products across all product lines. During fiscal year 1998,
enterprise systems unit sales grew 265%, notebook computer unit sales grew 66%
and desktop computer systems unit sales grew 55%, as the Company continued to
introduce products utilizing the latest technology.
Average revenue per unit sold in fiscal year 1999 decreased 10% compared to
fiscal year 1998, partially offsetting the effects of the increase in unit sales
on consolidated net revenue. The decrease was primarily due to price reductions
resulting from continued component cost declines.
Average revenue per unit sold in fiscal year 1998 remained relatively stable
compared to fiscal year 1997. This was primarily due to aggressive pricing
strategies in desktop computer systems, partially offset by increased unit sales
in higher-end enterprise systems and higher-platform notebook computers.
20
<PAGE> 22
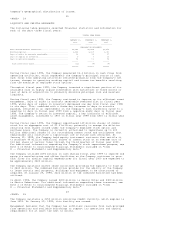
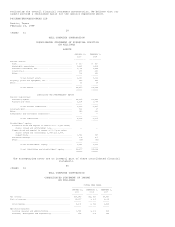
The Company experienced growth in net revenue in all geographic segments in both
fiscal years 1999 and 1998. The following table summarizes the Company's net
revenue by geographic segment for each of the past three fiscal years:
FISCAL YEAR ENDED
---------------------------------------------------------------------
JANUARY 29, PERCENTAGE FEBRUARY 1, PERCENTAGE FEBRUARY 2,
1999 INCREASE 1998 INCREASE 1997
----------- ---------- ----------- ---------- -----------
(DOLLARS IN MILLIONS)
Net revenue:
Americas.................... $12,420 46% $ 8,531 62% $5,279
Europe...................... 4,674 58 2,956 48 2,004
Asia-Pacific and Japan...... 1,149 37 840 77 476
------- ------- ------
Consolidated net revenue.... $18,243 $12,327 $7,759
======= ======= ======
In the Americas segment, net revenue grew 46% and 62% in fiscal years 1999 and
1998, respectively, as the Company continued its efforts to strengthen its
consumer, small-to-medium business and large corporate customer groups. In the
European segment, substantially all countries experienced revenue growth in
excess of 50% in fiscal years 1999 and 1998, with growth experienced across all
customer groups and product lines. As a result, Europe increased net revenue 58%
and 48% in fiscal years 1999 and 1998, respectively. Asia-Pacific and Japan
revenues increased 37% in fiscal year 1999, compared to a 77% increase in fiscal
year 1998.
Management believes that opportunity exists for continued worldwide growth by
increasing the Company's market presence in its existing markets, entering new
markets and pursuing additional product opportunities. The Company continues to
expand its product offerings to meet a variety of customer needs. Also, the
Company continues to enhance and improve the reputation, quality and breadth of
all of its product lines and services. The Company is continuing its efforts to
strengthen its position in enterprise systems by introducing advanced
technologies to serve the growing needs for these products. As a result, the
Company continues to expand its global manufacturing, sales and service
facilities, completing or announcing plans for one million square feet of