Dell 1998 Annual Report Download - page 16
Download and view the complete annual report
Please find page 16 of the 1998 Dell annual report below. You can navigate through the pages in the report by either clicking on the pages listed below, or by using the keyword search tool below to find specific information within the annual report.-
 1
1 -
2
-
3
-
4
-
5
-
 6
6 -
 7
7 -
 8
8 -
 9
9 -
 10
10 -
 11
11 -
 12
12 -
 13
13 -
 14
14 -
 15
15 -
 16
16 -
 17
17 -
 18
18 -
 19
19 -
 20
20 -
 21
21 -
 22
22 -
 23
23 -
 24
24 -
 25
25 -
 26
26 -
27
-
28
-
29
-
30
-
31
-
32
-
33
-
34
-
35
-
36
-
37
-
38
-
39
-
40
-
41
-
42
-
43
-
44
-
45
-
46
-
47
-
48
-
49
-
50
 |
 |
SALES OF UNREGISTERED SECURITIES
The Company has an active stock repurchase program, which is more fully
described in Note 6 of Notes to Consolidated Financial Statements included in
"Item 8 -- Financial Statements and Supplementary Data." One element of such
program is the sale of put obligations. During fiscal year 1999, the Company
sold 200,000 put obligations to a financial institution and received proceeds of
$1.5 million in connection with such sale. The put obligations entitle each
holder to sell to the Company, by physical delivery, cash delivery or net-share
settlement, at the Company's option, one share of common stock at a specified
price. The put obligations expire on January 7, 2000 and have an exercise price
of $40 per share. The transaction was exempt from registration under Section
4(2) of the Securities Act of 1933, as amended. The transaction was privately
negotiated and the purchaser of the put options was an accredited investor and
qualified institutional buyer. No public offering or public solicitation was
made by the Company in the placement of these securities.
18
<PAGE> 20
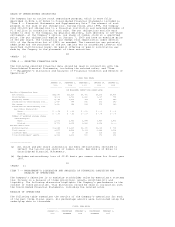
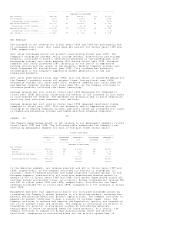
ITEM 6 -- SELECTED FINANCIAL DATA
The following selected financial data should be read in conjunction with the
Consolidated Financial Statements, including the related notes, and "Item
7 -- Management's Discussion and Analysis of Financial Condition and Results of
Operations."
FISCAL YEAR ENDED
-------------------------------------------------------------------
JANUARY 29, FEBRUARY 1, FEBRUARY 2, JANUARY 28, JANUARY 29,
1999 1998 1997 1996 1995
----------- ----------- ----------- ----------- -----------
(IN MILLIONS, EXCEPT PER SHARE DATA)
Results of Operations Data:
Net revenue........................ $18,243 $12,327 $7,759 $5,296 $3,475
Gross margin....................... 4,106 2,722 1,666 1,067 738
Operating income................... 2,046 1,316 714 377 249
Income before extraordinary loss... 1,460 944 531 272 149
Net income......................... 1,460 944 518 272 149
Income before extraordinary loss
per common share(a)(b):
Basic......................... $ 0.58 $ 0.36 $ 0.19 $ 0.09 $ 0.06
Diluted....................... $ 0.53 $ 0.32 $ 0.17 $ 0.08 $ 0.05
Number of weighted average shares
outstanding(a):
Basic......................... 2,531 2,631 2,838 2,863 2,473
Diluted....................... 2,772 2,952 3,126 3,158 3,000
Balance Sheet Data:
Working capital.................... $ 2,644 $ 1,215 $1,089 $1,018 $ 718
Total assets....................... 6,877 4,268 2,993 2,148 1,594
Long-term debt..................... 512 17 18 113 113
Total stockholders' equity......... 2,321 1,293 806 973 652
---------------
(a) All share and per share information has been retroactively restated to
reflect the two-for-one splits of common stock. See Note 6 of Notes to
Consolidated Financial Statements.
(b) Excludes extraordinary loss of $0.01 basic per common share for fiscal year
1997.
19
<PAGE> 21
ITEM 7 -- MANAGEMENT'S DISCUSSION AND ANALYSIS OF FINANCIAL CONDITION AND
RESULTS OF OPERATIONS
The Company's objective is to maximize stockholder value by executing a strategy
that focuses on a balance of three priorities: growth, profitability and
liquidity. The following discussion highlights the Company's performance in the
context of these priorities. This discussion should be read in conjunction with
the Consolidated Financial Statements, including the related notes.
RESULTS OF OPERATIONS
The following table summarizes the results of the Company's operations for each
of the past three fiscal years. All percentage amounts were calculated using the
underlying data in thousands.
FISCAL YEAR ENDED
-----------------------------------------------------------------
JANUARY 29, PERCENTAGE FEBRUARY 1, PERCENTAGE FEBRUARY 2,
1999 INCREASE 1998 INCREASE 1997