D-Link 2004 Annual Report Download - page 6
Download and view the complete annual report
Please find page 6 of the 2004 D-Link annual report below. You can navigate through the pages in the report by either clicking on the pages listed below, or by using the keyword search tool below to find specific information within the annual report.-
 1
1 -
 2
2 -
 3
3 -
 4
4 -
 5
5 -
 6
6 -
 7
7 -
 8
8 -
 9
9 -
 10
10 -
 11
11 -
 12
12 -
 13
13 -
 14
14 -
 15
15 -
 16
16 -
 17
17 -
18
-
19
-
20
-
21
-
22
-
23
-
24
-
25
-
26
-
27
-
28
-
29
-
30
-
31
-
32
-
33
-
34
-
35
-
36
-
37
-
38
-
39
-
40
-
41
-
42
-
43
-
44
-
45
-
46
-
47
-
48
-
49
-
50
-
51
-
52
-
53
-
54
-
55
-
56
-
57
-
58
-
59
-
60
-
61
-
62
-
63
-
64
-
65
-
66
-
67
-
68
 |
 |

4 D-Link 2004 Annual Report
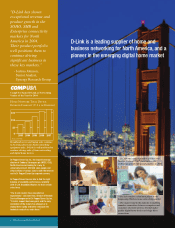
Technology expertise,
market forecasting and
product breadth give
D-Link the strength to
aggressively compete
with quality hardware
at an affordable price
point in a variety of
markets
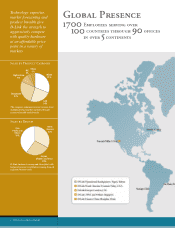
WLAN
31%
Others
5%
NIC
4%
Digital Home
9%
Broadband
27%
LAN
24%
North
America
33%
Asia
Pacific and
Others
34%
Europe,
Middle East, Africa
33%
Sales by Product Category
Sales by Region
D-Link business is strong and diversified, with
balanced revenue contribution coming from all
regional business units
The company maintains revenue streams from
multiple product market segments through
extensive breadth and diversity
Employees serving over
countries through offices
in over continents 90
700
1
5
Global Presence
00
1