Creative 2001 Annual Report Download - page 8
Download and view the complete annual report
Please find page 8 of the 2001 Creative annual report below. You can navigate through the pages in the report by either clicking on the pages listed below, or by using the keyword search tool below to find specific information within the annual report.-
 1
1 -
 2
2 -
 3
3 -
 4
4 -
 5
5 -
 6
6 -
 7
7 -
 8
8 -
 9
9 -
 10
10 -
 11
11 -
 12
12 -
 13
13 -
 14
14 -
 15
15 -
 16
16 -
 17
17 -
 18
18 -
 19
19 -
20
-
21
-
22
-
23
-
24
-
25
-
26
-
27
-
28
-
29
-
30
-
31
-
32
-
33
-
34
-
35
-
36
-
37
-
38
-
39
-
40
 |
 |

8
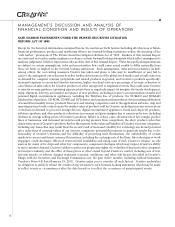
MANAGEMENT’S DISCUSSION AND ANALYSIS OF
FINANCIAL CONDITION AND RESULTS OF OPERATIONS
YEAR ENDED JUNE 30, 2001 COMPARED TO YEAR ENDED JUNE 30, 2000
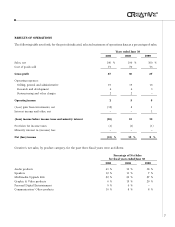
Net sales for the year ended June 30, 2001 decreased by 9% compared to the year ended June 30, 2000. Audio product
sales (Sound Blaster audio cards and chipsets) for fiscal year 2001 decreased marginally by 2% compared to fiscal
year 2000 primarily due to weaker demand in the system integrator and original equipment manufacturer (“OEM”)
channels. As a percentage of total sales, audio product sales increased to 41% of sales compared to 39% of sales in
fiscal year 2000. Sales of multimedia upgrade kits (“MMUK”), including data storage, decreased by 12% in fiscal
year 2001 and represented 22% of sales compared to 23% of sales in the prior fiscal year. Within MMUK, sales of
audio upgrade kits and CD-ROM drives declined but their impact on total sales was partially offset by an increase
in sales of Compact Disk ReWritable (“CD-RW”) drives. The decline in sales of multimedia audio upgrade kits,
which comprised a combination of sound cards and CD-ROM drives is mainly due to the downturn in the PC
business. Sales of video and graphics products decreased by 63% and represented 6% of sales in fiscal year 2001
compared with fiscal year 2000, when they represented 15% of sales. The decline in sales was due to management’s
decision to reduce its reliance on lower margin graphics products. Sales of personal digital entertainment products
(“PDE”) which include digital audio players and digital cameras increased by 95% to represent 9% of sales compared
to fiscal 2000 when they represented 4% of sales. This increase in sales was primarily due to an increase in sales
of the NOMAD Jukebox product introduced in the first quarter of fiscal year 2001. Sales of speakers increased
marginally by 2% and represented 12% of sales in fiscal 2001 compared with fiscal 2000, when they represented
11% of sales. This improvement in speaker sales was primarily a result of the introduction of new models of multi-
media speakers. Sales of other products, which included accessories, music products, communication products and
other miscellaneous items, increased by 8% and represented 10% of sales in fiscal 2001 compared to 8% of sales
in the prior fiscal year. This increase in other product sales was primarily due to an increase in sales of communication
products.
Gross profit in fiscal 2001 declined by 16% to represent 27% of sales compared to 30% in fiscal 2000. Margins in
fiscal 2001 were negatively impacted by a decline in the average selling prices of drives and PDE products and an
$8.2 million inventory restructuring charge applied to cost of goods sold.
Selling, general and administrative (“SG&A”) expenses in fiscal 2001 declined by 8% and were flat at 19% of sales
compared to fiscal 2000. SG&A expenses declined due to management’s cost cutting efforts and reduction in
expenses incurred on non-revenue generating Internet activities. Research and development (“R&D”) expenses in
fiscal 2001 remained flat at 4% of sales compared with fiscal 2000.
Restructuring and other charges of $22.8 million booked in fiscal 2001 comprised restructuring charges totaling $8.4
million, $3.2 million write-downs of fixed assets and write-off of other assets acquired from Aureal amounting to
$11.2 million. See Notes 13 of “Notes to Consolidated Financial Statements.”
In fiscal 2001, Creative’s net loss from investments was $148.5 million compared to a net gain of $103.4 million in
fiscal 2000. The loss relates to $200.3 million of losses from permanent write-downs of quoted and unquoted
investments, offset partially by a $51.8 million net gain from sales of quoted investments and marketable securities.
Net interest and other income decreased by $2.9 million to $2.4 million in fiscal 2001 compared to $5.3 million in
the prior fiscal year. This decline was primarily a result of a reduction in interest income arising from a lower average
cash balance.
Creative’s provision for income taxes for fiscal 2001 remained flat at 1% of sales as compared to the prior fiscal year.
The provision for income taxes as a percentage of income before taxes and minority interest excluding net loss or
gain from investments increased from 14% in fiscal 2000 to 31% in fiscal 2001. The increase was primarily due
to a higher effective tax rate in Singapore due to the expiration of the Singapore pioneer status in March 2000, and
changes in the mix of taxable income arising from various geographical regions, where the tax rates range from 0%
to 50%. Creative has applied for a separate and new Pioneer Certificate covering a new range of products. If Creative
is awarded this new Pioneer Certificate, profits from qualified products under the new Pioneer Certificate will be
exempted from tax in Singapore. In the event that Creative fails to obtain the new Pioneer Certificate, future taxable
income in Singapore shall be subjected to a statutory tax rate of 24.5%. There can be no assurance that Creative
will be awarded a new Pioneer Certificate; and, if awarded, the rate may be higher than historical experience.