Creative 2001 Annual Report Download - page 10
Download and view the complete annual report
Please find page 10 of the 2001 Creative annual report below. You can navigate through the pages in the report by either clicking on the pages listed below, or by using the keyword search tool below to find specific information within the annual report.-
 1
1 -
 2
2 -
 3
3 -
 4
4 -
 5
5 -
 6
6 -
 7
7 -
 8
8 -
 9
9 -
 10
10 -
 11
11 -
 12
12 -
 13
13 -
 14
14 -
 15
15 -
 16
16 -
 17
17 -
 18
18 -
 19
19 -
 20
20 -
 21
21 -
22
-
23
-
24
-
25
-
26
-
27
-
28
-
29
-
30
-
31
-
32
-
33
-
34
-
35
-
36
-
37
-
38
-
39
-
40
 |
 |

10
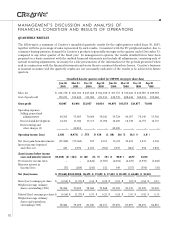
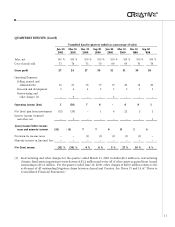
QUARTERLY RESULTS
The following is a summary of Creative’s unaudited quarterly results for the eight quarters ended June 30, 2001,
together with the percentage of sales represented by such results. Consistent with the PC peripheral market, due to
consumer buying patterns, demand for Creative’s products is generally stronger in the quarter ended December 31,
compared to any other quarter of the fiscal year. In management’s opinion, the results detailed below have been
prepared on a basis consistent with the audited financial statements and include all adjustments, consisting only of
normal recurring adjustments, necessary for a fair presentation of the information for the periods presented when
read in conjunction with the financial statements and notes thereto contained elsewhere herein. Creative’s business
is seasonal in nature and the quarterly results are not necessarily indicative of the results to be achieved in future
quarters.
Unaudited data for quarters ended (in US$’000 except per share data)
Jun 30 Mar 31 Dec 31 Sep 30 Jun 30 Mar 31 Dec 31 Sep 30
2001 2001 2000 2000 2000 2000 1999 1999
Sales, net $ 234,178 $ 263,030 $ 427,026 $ 304,368 $ 307,715 $ 330,022 $ 436,789 $ 269,078
Cost of goods sold 170,211 199,622 313,069 211,334 212,739 228,444 306,912 199,062
Gross profit 63,967 63,408 113,957 93,034 94,976 101,578 129,877 70,016
Operating expenses:
Selling, general and
administrative 49,100 55,685 70,064 58,102 59,724 64,167 76,340 53,502
Research and development 12,431 11,380 15,115 15,096 16,460 16,538 14,717 12,713
Restructuring and
other charges (1) – 22,814 – – 20,000 – – –
Operating income (loss) 2,436 (26,471) 28,778 19,836 (1,208) 20,873 38,820 3,801
Net (loss) gain from investments (75,988) (75,360) 507 2,351 19,211 70,632 9,235 4,365
Interest income (expense)
and other, net 183 1,090 2,055 (912) 1,055 (542) 918 3,856
(Loss) income before income
taxes and minority interest (73,369) (100,741) 31,340 21,275 19,058 90,963 48,973 12,022
Provision for income taxes – – (4,624) (3,785) (2,004) (2,327) (3,939) (1,202)
Minority interest in
(income) loss (71) (289) (241) 132 349 (317) (554) (10)
Net (loss) income $ (73,440)$(101,030)$ 26,475 $ 17,622 $ 17,403 $ 88,319 $ 44,480 $ 10,810
Basic (loss) earnings per share $ (0.94) $ (1.27) $ 0.34 $ 0.22 $ 0.21 $ 1.09 $ 0.54 $ 0.13
Weighted average ordinary
shares outstanding (’000) 78,084 79,299 78,964 79,848 81,367 81,339 81,999 83,410
Diluted (loss) earnings per share $ (0.94) $ (1.27) $ 0.33 $ 0.21 $ 0.20 $ 1.01 $ 0.52 $ 0.13
Weighted average ordinary
shares and equivalents
outstanding (’000) 78,084 79,299 81,180 84,151 87,605 87,697 86,291 84,855
MANAGEMENT’S DISCUSSION AND ANALYSIS OF
FINANCIAL CONDITION AND RESULTS OF OPERATIONS