Creative 2001 Annual Report Download - page 12
Download and view the complete annual report
Please find page 12 of the 2001 Creative annual report below. You can navigate through the pages in the report by either clicking on the pages listed below, or by using the keyword search tool below to find specific information within the annual report.-
 1
1 -
 2
2 -
 3
3 -
 4
4 -
 5
5 -
 6
6 -
 7
7 -
 8
8 -
 9
9 -
 10
10 -
 11
11 -
 12
12 -
 13
13 -
 14
14 -
 15
15 -
 16
16 -
 17
17 -
 18
18 -
 19
19 -
 20
20 -
 21
21 -
 22
22 -
23
-
24
-
25
-
26
-
27
-
28
-
29
-
30
-
31
-
32
-
33
-
34
-
35
-
36
-
37
-
38
-
39
-
40
 |
 |

12
MANAGEMENT’S DISCUSSION AND ANALYSIS OF
FINANCIAL CONDITION AND RESULTS OF OPERATIONS
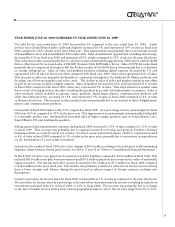
LIQUIDITY AND CAPITAL RESOURCES
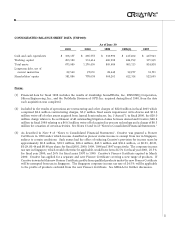
Cash and cash equivalents at June 30, 2001 were $168.2 million, a decrease of $117.6 million compared to the balance
of $285.8 million at June 30, 2000.
Operating Activities: Net cash generated from operating activities during fiscal 2001 was $76.9 million compared
with $160.2 million in fiscal 2000. The cash generated during fiscal 2001 primarily resulted from the net loss of
$130.4 million being more than offset by net adjustments of $196.5 million for non-cash items including depreciation
and amortization of $27.0 million, investments and other non-current asset write offs of $17.4 million, and net loss
from investments of $147.4 million. Also contributing to the cash generated from operating activities were net
decreases in marketable securities of $17.6 million, other assets and prepaids of $15.7 million, and inventory of $75.1
million which is in line with the management’s decision to maintain a lower inventory level. However, the positive
cash flow was offset partially by a net reduction in accounts payable, other accrued liabilities and income taxes
payable of $101.9 million, resulting in the net cash generated of $76.9 million.
Cash from operating activities for fiscal 2000 was primarily generated from net income of $161.0 million, partially
offset by net adjustments of $44.3 million for non-cash items including depreciation and amortization of $35.6
million, amortization of deferred share compensation of $4.6 million, investment write off of $9.8 million, and net
gain from investments of $94.7 million. Also included in cash generated from operating activities were net increases
in accounts payable, other accrued liabilities and income taxes payable amounting to $131.2 million, decreases in
other assets, prepaids and accounts receivable of $16.0 million, offset by an increase in inventory of $82.6 million
due to stockpiling to safeguard against component shortages. In addition, $21.1 million was used to purchase
marketable securities during fiscal 2000.
Investing Activities: Net cash used for investing activities during fiscal 2001 was $69.1 million compared with
$104.3 million in fiscal 2000. The amount used in fiscal 2001 comprises the purchase of investments of $110.4
million, capital expenditures of $34.5 million, and the acquisition of other non current assets of $13.1 million,
including assets from Aureal. The cash used in investing activities was offset in part by the proceeds from sale of
quoted investments amounting to $88.9 million.
Net cash used for investing activities during fiscal 2000 was $104.3 million compared with $38.4 million in fiscal
1999. The balance in fiscal 2000 includes the purchase of investments of $228.2 million and the acquisition of capital
and other assets amounting to $22.6 million. The cash used in investing activities was offset in part by the proceeds
from sale of quoted investments amounting to $146.5 million.
Financing Activities: During fiscal 2001, $125.4 million was used for financing activities compared with $89.1
million in fiscal 2000. Cash used for financing included $91.0 million to purchase and retire 7.7 million of Creative’s
ordinary shares (See Note 6 of “Notes to Consolidated Financial Statements”), $39.4 million for dividends paid (See
Note 7 of “Notes to Consolidated Financial Statements”), and $4.5 million to repay long-term obligations. The cash
used in financing activities was offset partially by cash generated from exercises of Creative’s stock options amounting
to $9.3 million.
During fiscal 2000, $89.1 million was used for financing activities compared with $184.0 in fiscal 1999. Cash used
in financing included $102.2 million to purchase and retire 5.9 million of Creative’s ordinary shares (See Note 6 of
“Notes to Consolidated Financial Statements”), $20.6 million for dividend payment (See Note 7 of “Notes to
Consolidated Financial Statements”), and $5.7 million to repay long-term obligations and minority shareholders’
loan and equity balance. The cash used in financing activities was offset partially by cash generated from exercises
of Creative’s stock options amounting to $16.9 million and proceeds from the issuance of preference shares to
minority shareholders by one of Creative’s subsidiaries amounting to $22.5 million.
As of June 30, 2001, in addition to cash reserves and excluding the term loan, Creative had unutilized credit facilities
totaling approximately $116.3 million for overdrafts, guarantees and letters of credit. Creative continually reviews
and evaluates investment opportunities, including potential acquisitions of, and investments in, companies that can
provide Creative with technologies, subsystems or complementary products that can be integrated into or offered
with its existing product range. Creative generally satisfies its working capital needs from internally generated cash
flows. Management believes that Creative has adequate resources to meet its projected working capital and other
cash needs for at least the next twelve months.
RECENTLY ISSUED ACCOUNTING PRONOUNCEMENTS
Please refer to Note 1 of “Notes to Consolidated Financial Statements” for the discussion of recently issued accounting
pronouncements.