Comfort Inn 2014 Annual Report Download - page 8
Download and view the complete annual report
Please find page 8 of the 2014 Comfort Inn annual report below. You can navigate through the pages in the report by either clicking on the pages listed below, or by using the keyword search tool below to find specific information within the annual report.-
 1
1 -
 2
2 -
 3
3 -
 4
4 -
 5
5 -
 6
6 -
 7
7 -
 8
8 -
 9
9 -
 10
10 -
 11
11 -
 12
12 -
 13
13 -
 14
14 -
 15
15 -
 16
16 -
 17
17 -
 18
18 -
 19
19 -
20
-
21
-
22
-
23
-
24
-
25
-
26
-
27
-
28
-
29
-
30
-
31
-
32
-
33
-
34
-
35
-
36
-
37
-
38
-
39
-
40
-
41
-
42
-
43
-
44
-
45
-
46
-
47
-
48
-
49
-
50
-
51
-
52
-
53
-
54
-
55
-
56
-
57
-
58
-
59
-
60
-
61
-
62
-
63
-
64
-
65
-
66
-
67
-
68
-
69
-
70
-
71
-
72
-
73
-
74
-
75
-
76
-
77
-
78
-
79
-
80
-
81
-
82
-
83
-
84
-
85
-
86
-
87
-
88
-
89
-
90
-
91
-
92
-
93
-
94
-
95
-
96
-
97
-
98
-
99
-
100
-
101
-
102
-
103
-
104
-
105
-
106
-
107
-
108
-
109
-
110
-
111
-
112
-
113
-
114
-
115
-
116
-
117
-
118
-
119
-
120
-
121
-
122
-
123
-
124
-
125
-
126
-
127
-
128
-
129
-
130
-
131
-
132
-
133
-
134
-
135
-
136
-
137
-
138
-
139
-
140
-
141
-
142
-
143
-
144
 |
 |

Table of Contents
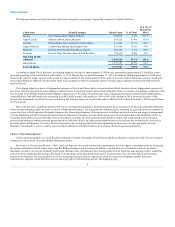
The lodging industry can be divided into chain scale categories or groupings of generally competitive brands as follows:
Luxury
Four Seasons, Ritz Carlton, W Hotel
108,077
2.2%
337.7
Upper Upscale
Marriott, Hilton, Hyatt, Sheraton
568,525
11.4%
359.4
Upscale
Hilton Garden Inn, Courtyard, Cambria Suites
631,245
12.7%
152.1
Upper Midscale
Comfort Inn, Holiday Inn, Hampton Inn
876,164
17.6%
97.9
Midscale
Quality, Best Western, Ramada, La Quinta
483,144
9.7%
85.6
Economy
Econo Lodge, Days Inn, Super 8, Red Roof Inn
774,363
15.6%
75.9
Independents
1,537,187
30.9%
68.1
According to Smith Travel Research, the lodging industry consisted of approximately 53,000 hotels representing approximately 5.0 million rooms
open and operating in the United States at December 31, 2014. During the year ended December 31, 2014, the industry added approximately 63,000 gross
rooms to the industry supply and net room growth was approximately 0.8%. Approximately, 49% of the new rooms opened during the year were positioned
in the Upper Midscale, Midscale and Economy chain scale segments in which we primarily operate. Overall, annual industry room growth remains below
historical levels.
The lodging industry consists of independent operators of hotels and those that have joined national hotel franchise chains. Independent operators of
hotels not owned or managed by major lodging companies have increasingly joined national hotel franchise chains as a means of remaining competitive with
hotels owned by or affiliated with national lodging companies. Over the years, the industry has seen a significant movement of hotels from independent to
chain affiliation, with affiliated hotels increasing from 46% of the rooms in the market in 1990 to 69% of the market in 2014. However, the pace of this
increase has moderated over the last several years and in 2014 the percentage of rooms in the market affiliated with a chain increased by 20 basis points from
68.9% to 69.1%.
Due to the fact that a significant portion of the costs of owning and operating a hotel are generally fixed, increases in revenues generated by affiliation
with a franchise lodging chain can improve a hotel’s financial performance. The large franchise lodging chains, including us, generally provide a number of
support services to hotel operators designed to improve the financial performance of their properties including central reservation and property management
systems, marketing and advertising programs, training and education programs, revenue enhancement services and relationships with qualified vendors to
streamline purchasing processes and make lower cost products available. We believe that national franchise chains with a large number of hotels enjoy
greater brand awareness among potential guests than those with fewer hotels, and that greater brand awareness can increase the desirability of a hotel to its
potential guests. Furthermore, we believe that hotel operators choose lodging franchisors based primarily on the perceived value and quality of each
franchisor’s brand and its services, and the extent to which affiliation with that franchisor may increase the hotel operator profitability.
Choice’s Franchising Business
Choice operates primarily as a hotel franchisor offering 11 brands. This family of well-known and diversified new construction and conversion brands
competes at various hotel consumer and developer price points.
Economics of Franchising Business. The fee and cost structure of our business provides opportunities for us to improve operating results by increasing
the number of franchised hotel rooms, improving RevPAR performance and increasing the effective royalty rates of our franchise contracts. As a hotel
franchisor, we derive our revenue primarily from various franchise fees. Our franchise fees consist primarily of an initial fee and ongoing royalty, marketing
and reservation system fees that are typically based on a percentage of the franchised hotel’s gross room revenues. The initial fee and on-going royalty
portion of the franchise fees are intended to cover our operating expenses, such as expenses incurred in business development, quality assurance,
administrative support, certain franchise services and to provide us with operating profits. The marketing and
8