Comfort Inn 2013 Annual Report Download - page 7
Download and view the complete annual report
Please find page 7 of the 2013 Comfort Inn annual report below. You can navigate through the pages in the report by either clicking on the pages listed below, or by using the keyword search tool below to find specific information within the annual report.-
 1
1 -
 2
2 -
 3
3 -
 4
4 -
 5
5 -
 6
6 -
 7
7 -
 8
8 -
 9
9 -
 10
10 -
 11
11 -
 12
12 -
 13
13 -
 14
14 -
 15
15 -
 16
16 -
 17
17 -
 18
18 -
19
-
20
-
21
-
22
-
23
-
24
-
25
-
26
-
27
-
28
-
29
-
30
-
31
-
32
-
33
-
34
-
35
-
36
-
37
-
38
-
39
-
40
-
41
-
42
-
43
-
44
-
45
-
46
-
47
-
48
-
49
-
50
-
51
-
52
-
53
-
54
-
55
-
56
-
57
-
58
-
59
-
60
-
61
-
62
-
63
-
64
-
65
-
66
-
67
-
68
-
69
-
70
-
71
-
72
-
73
-
74
-
75
-
76
-
77
-
78
-
79
-
80
-
81
-
82
-
83
-
84
-
85
-
86
-
87
-
88
-
89
-
90
-
91
-
92
-
93
-
94
-
95
-
96
-
97
-
98
-
99
-
100
-
101
-
102
-
103
-
104
-
105
-
106
-
107
-
108
-
109
-
110
-
111
-
112
-
113
-
114
-
115
-
116
-
117
-
118
-
119
-
120
-
121
-
122
-
123
-
124
-
125
-
126
-
127
-
128
-
129
-
130
-
131
-
132
-
133
-
134
-
135
-
136
-
137
-
138
-
139
-
140
-
141
-
142
 |
 |

Table of Contents
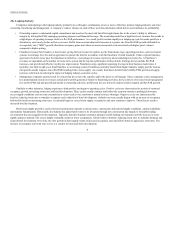
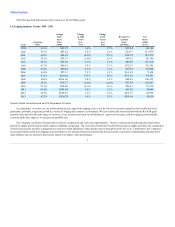
The following chart demonstrates these trends over the last fifteen years:
1999
63.3%
$81.27
3.4 %
2.7 %
$51.44
143,148
2000
63.5%
$85.24
4.9 %
3.4 %
$54.13
121,476
2001
60.1%
$84.85
(0.5)%
2.9 %
$50.99
101,279
2002
59.2%
$83.15
(2.0)%
1.6 %
$49.22
86,366
2003
59.1%
$83.19
0.1 %
2.3 %
$49.20
65,876
2004
61.3%
$86.41
3.9 %
2.7 %
$52.93
55,245
2005
63.1%
$90.84
5.1 %
3.4 %
$57.34
65,900
2006
63.4%
$97.31
7.1 %
3.2 %
$61.69
73,308
2007
63.1%
$104.04
6.9 %
2.8 %
$65.61
94,541
2008
60.3%
$106.96
2.8 %
3.8 %
$64.49
146,312
2009
54.5%
$98.17
(8.2)%
(0.4)%
$53.50
142,287
2010
57.5%
$98.06
(0.1)%
1.6 %
$56.43
73,976
2011
59.9%
$101.85
3.9 %
3.2 %
$61.02
38,409
2012
61.3%
$106.25
4.3 %
2.1 %
$65.15
43,879
2013
62.3%
$110.35
3.9 %
1.5 %
$68.69
54,020
(Source: Smith Travel Research and US Department of Labor)
As a franchisor, we believe we are well positioned in any stage of the lodging cycle as our fee-for-service business model has historically delivered
predictable, profitable, long-term growth in a variety of lodging and economic environments. We have historically benefited from both the RevPAR gains
typically experienced in the early stages of recovery, as our revenues are based on our franchisees’ gross room revenues, and the supply growth normally
occurring in the later stages as we increase our portfolio size.
The Company’s portfolio of brands offers both new construction and conversion opportunities. Our new construction brands typically benefit from
periods of supply growth and favorable capital availability and pricing. Our conversion brands also benefit from periods of supply growth as the construction
of hotels increases the need for existing hotels to seek new brand affiliations as their product moves through the hotel life cycle. Furthermore, the Company's
conversion brands benefit from lodging cycle downturns as our unit growth has been historically driven from the conversion of independent and other hotel
chain affiliates into our system as these hotels endeavor to improve their performance.
7