Comfort Inn 2013 Annual Report Download - page 18
Download and view the complete annual report
Please find page 18 of the 2013 Comfort Inn annual report below. You can navigate through the pages in the report by either clicking on the pages listed below, or by using the keyword search tool below to find specific information within the annual report.-
 1
1 -
2
-
3
-
4
-
5
-
6
-
7
-
 8
8 -
 9
9 -
 10
10 -
 11
11 -
 12
12 -
 13
13 -
 14
14 -
 15
15 -
 16
16 -
 17
17 -
 18
18 -
 19
19 -
 20
20 -
 21
21 -
 22
22 -
 23
23 -
 24
24 -
 25
25 -
 26
26 -
 27
27 -
 28
28 -
29
-
30
-
31
-
32
-
33
-
34
-
35
-
36
-
37
-
38
-
39
-
40
-
41
-
42
-
43
-
44
-
45
-
46
-
47
-
48
-
49
-
50
-
51
-
52
-
53
-
54
-
55
-
56
-
57
-
58
-
59
-
60
-
61
-
62
-
63
-
64
-
65
-
66
-
67
-
68
-
69
-
70
-
71
-
72
-
73
-
74
-
75
-
76
-
77
-
78
-
79
-
80
-
81
-
82
-
83
-
84
-
85
-
86
-
87
-
88
-
89
-
90
-
91
-
92
-
93
-
94
-
95
-
96
-
97
-
98
-
99
-
100
-
101
-
102
-
103
-
104
-
105
-
106
-
107
-
108
-
109
-
110
-
111
-
112
-
113
-
114
-
115
-
116
-
117
-
118
-
119
-
120
-
121
-
122
-
123
-
124
-
125
-
126
-
127
-
128
-
129
-
130
-
131
-
132
-
133
-
134
-
135
-
136
-
137
-
138
-
139
-
140
-
141
-
142
 |
 |

Table of Contents
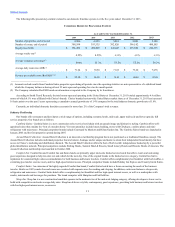
The following table presents key worldwide system size statistics as of and for the year ended December 31, 2013:
Comfort 1,824
141,220
120
9,528
55
(37)
(80)
Comfort
Suites 604
47,375
55
4,187
15
(2)
(21)
Quality 1,595
139,703
71
5,724
122
36
(81)
Ascend Hotel
Collection 123
12,196
22
1,894
53
4
(6)
Clarion 321
44,888
22
2,479
32
(3)
(28)
Sleep Inn 391
28,518
55
3,579
13
(5)
(13)
MainStay
Suites 45
3,549
36
2,491
2
—
—
Econo Lodge 914
54,434
32
1,860
65
3
(53)
Rodeway Inn 441
24,800
39
1,748
55
6
(33)
Suburban 64
7,256
26
2,224
3
(2)
(2)
Cambria
Suites 18
2,119
25
3,243
1
—
(2)
Totals 6,340
506,058
503
38,957
416
—
(319)
Franchise Sales
Brand growth is important to our business model. We have identified key market areas for hotel development based on supply/demand relationships
and our strategic objectives. Development opportunities are typically offered to: (i) existing franchisees; (ii) developers of hotels; (iii) owners of independent
hotels and motels; (iv) owners of hotels leaving other franchisors’ brands; and, (v) franchisees of non-hotel related products such as restaurants.
Our franchise sales organization is structured to support the Company’s efforts to leverage its core strengths in order to take advantage of opportunities
for further growth. The franchise sales organization employs both sales managers as well as franchise sales directors. This organization emphasizes the
benefits of affiliating with the Choice system, our commitment to improving hotel profitability, our central reservation delivery services, our marketing and
customer loyalty programs, our training and support systems (including our proprietary property management systems) and our Company’s track record of
growth and profitability to potential franchisees. Franchise sales directors are assigned to specific brands to leverage their brand expertise to enhance product
consistency and deal flow. Our sales managers ensure each prospective hotel is placed in the appropriate brand, facilitate teamwork and information sharing
amongst the sales directors and provide better service to our potential franchisees. The structure of this organization supports the Company’s efforts to leverage
its core strengths in order to take advantage of opportunities for further growth. Integrating our brands and strategies allow our brand teams to focus on
understanding, anticipating and meeting the unique needs of our customers.
Our objective is to continue to grow our portfolio by continuing to sell our existing brands, creating extensions of our existing brands and introducing
new brands, either organically or via acquisition, within the various lodging chain categories. Based on market conditions and other circumstances, we may
offer certain incentives to developers to increase development of our brands such as discounting various fees such as the initial franchise fee and royalty rates
as well as provide financing for property improvements and other purposes.
Because retention of existing franchisees is important to our growth strategy, we have a formal impact policy. This policy offers existing franchisees
protection from the opening of a same-brand property within a specified distance, depending upon the market in which the property is located.
Investment, Financing and Guaranty Franchisee Support
Our board of directors authorized a program which permits us to offer financing, investment, and guaranty support to qualified franchisees as well as
allows us to acquire and resell real estate to incent franchise development for certain brands in strategic markets. We expect to deploy capital pursuant to this
program opportunistically to promote growth of our emerging brands. The amount and timing of the investment in this program will be dependent on market
and other conditions. Our current expectation is that our annual investment in this program will range from $20 million to $40 million per year and we
generally expect to recycle these investments within a five year period. However, our actual investment in this program will be dependent on market and other
conditions.
18