Comfort Inn 2013 Annual Report Download - page 14
Download and view the complete annual report
Please find page 14 of the 2013 Comfort Inn annual report below. You can navigate through the pages in the report by either clicking on the pages listed below, or by using the keyword search tool below to find specific information within the annual report.-
 1
1 -
2
-
3
-
 4
4 -
 5
5 -
 6
6 -
 7
7 -
 8
8 -
 9
9 -
 10
10 -
 11
11 -
 12
12 -
 13
13 -
 14
14 -
 15
15 -
 16
16 -
 17
17 -
 18
18 -
 19
19 -
 20
20 -
 21
21 -
 22
22 -
 23
23 -
 24
24 -
25
-
26
-
27
-
28
-
29
-
30
-
31
-
32
-
33
-
34
-
35
-
36
-
37
-
38
-
39
-
40
-
41
-
42
-
43
-
44
-
45
-
46
-
47
-
48
-
49
-
50
-
51
-
52
-
53
-
54
-
55
-
56
-
57
-
58
-
59
-
60
-
61
-
62
-
63
-
64
-
65
-
66
-
67
-
68
-
69
-
70
-
71
-
72
-
73
-
74
-
75
-
76
-
77
-
78
-
79
-
80
-
81
-
82
-
83
-
84
-
85
-
86
-
87
-
88
-
89
-
90
-
91
-
92
-
93
-
94
-
95
-
96
-
97
-
98
-
99
-
100
-
101
-
102
-
103
-
104
-
105
-
106
-
107
-
108
-
109
-
110
-
111
-
112
-
113
-
114
-
115
-
116
-
117
-
118
-
119
-
120
-
121
-
122
-
123
-
124
-
125
-
126
-
127
-
128
-
129
-
130
-
131
-
132
-
133
-
134
-
135
-
136
-
137
-
138
-
139
-
140
-
141
-
142
 |
 |

Table of Contents
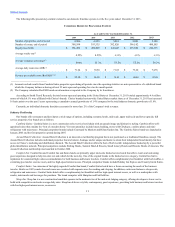
Number of properties, end of period 61
64
60
63
63
Number of rooms, end of period 7,416
7,685
7,126
7,291
7,167
Royalty fees ($000) $2,275
$2,353
$2,537
$2,697
$2,815
Average occupancy percentage 56.3%
63.8%
67.5%
69.7%
70.1%
Average daily room rate (ADR) $41.51
$39.23
$40.26
$41.61
$42.67
RevPAR $23.35
$25.03
$27.15
$29.01
$29.91
Number of properties, end of period 18
23
19
19
18
Number of rooms, end of period 2,073
2,700
2,215
2,221
2,119
Royalty fees ($000) $920
$1,447
$2,022
$2,099
$2,133
Number of properties, end of period 28
38
52
57
102
Number of rooms, end of period 2,346
3,025
4,617
4,982
9,206
Royalty fees ($000) $ 679
$1,129
$1,655
$2,389
$3,641
Average occupancy percentage 49.4%
57.6%
60.3%
64.4%
64.3%
Average daily room rate (ADR) $115.97
$112.50
$113.59
$113.33
$120.97
RevPAR $57.24
$64.81
$68.44
$72.94
$77.82
____________________________
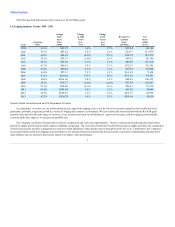
(1) Statistics for average occupancy percentage, ADR and RevPAR have been excluded for years in which the brand statistics are not representative of a stabilized brand which the
Company defines as having at least 25 units open and operating for a twelve month period.
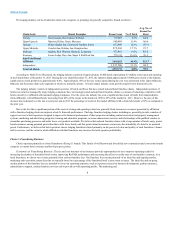
International Franchise Operations
The Company conducts its international franchise operations through a combination of direct franchising and master franchising relationships. Master
franchising relationships are governed by master franchising agreements that generally provide the master franchisee with the right to use and sub-license the
use of our brands in a specific geographic region, usually for a fee.
Our business philosophy has been to conduct direct franchising in those international markets where both franchising is an accepted business model
and we believe our brands can achieve significant distribution. We typically elect to enter into master franchise agreements in those markets where direct
franchising is currently not a prevalent or viable business model. When entering into master franchising relationships, we strive to select partners that have
professional hotel and asset management capabilities together with the financial capacity to invest in building the Choice brands in their respective markets.
Master franchising relationships typically provide lower revenues to the Company as the master franchisees are responsible for managing certain necessary
services (such as training, quality assurance, reservations and marketing) to support the franchised hotels in the master franchise area and therefore retain a
larger percentage of the hotel franchise fees to cover their expenses. In certain circumstances, the Company has and may continue to make equity investments
in our master franchisees.
As a result of our use of master franchising relationships and international market conditions, revenues from international franchising operations
comprised 8% of our total revenues in both 2013 and 2012 while representing approximately 18% and 19% of our franchise system hotels open at both
December 31, 2013 and 2012, respectively.
In some territories outside the United States hotel franchising is less prevalent, and many markets are served primarily by independent operators. We
believe that chain and franchise affiliation will increase in certain international markets as local economies grow and hotel owners seek the economies of
centralized reservations systems and marketing programs. We believe that international franchise operations will provide a significant long-term growth
opportunity for the Company and as a result we have embarked on a multi-year investment in information technology and marketing which is expected to
enhance the value proposition for prospective international franchisees.
14