Comfort Inn 2004 Annual Report Download - page 12
Download and view the complete annual report
Please find page 12 of the 2004 Comfort Inn annual report below. You can navigate through the pages in the report by either clicking on the pages listed below, or by using the keyword search tool below to find specific information within the annual report.-
 1
1 -
 2
2 -
 3
3 -
 4
4 -
 5
5 -
 6
6 -
 7
7 -
 8
8 -
 9
9 -
 10
10 -
 11
11 -
 12
12 -
 13
13 -
 14
14 -
 15
15 -
 16
16 -
 17
17 -
 18
18 -
 19
19 -
 20
20 -
 21
21 -
 22
22 -
23
-
24
-
25
-
26
-
27
-
28
-
29
-
30
-
31
-
32
-
33
-
34
-
35
-
36
-
37
-
38
-
39
-
40
-
41
-
42
-
43
-
44
-
45
-
46
-
47
-
48
-
49
-
50
-
51
-
52
-
53
-
54
-
55
-
56
 |
 |

Operations Review
Comparison of 2004 Operating Results and 2003 Operating Results
The Company recorded net income of $74.3 million for the year ended December 31, 2004, an increase of
$2.4 million from $71.9 million for the year ended December 31, 2003. The increase in net income for the year is
primarily attributable to an $11.0 million improvement in operating income partially offset by an $8.9 million
increase in other income and expenses. Interest and other investment income in 2003 included $4.5 million of
interest income and a $3.4 million gain on the prepayment attributable to the Sunburst note receivable. As a
result of Sunburst’s prepayment, these items did not recur in 2004. Operating income increased as a result of a
$16.7 million increase in franchising revenues (total revenues excluding marketing and reservation revenues and
hotel operations) and a decrease in depreciation and amortization expense partially offset by an increase in
selling, general and administrative expense. Net other income and expenses for 2004 increased primarily as a
result of a $0.7 million loss on extinguishment of debt, a reduction of the $3.4 million prepayment gain and $4.5
million of interest income attributable to the December 2003 repayment of a note receivable from Sunburst and
reductions in investment income attributable to non-qualified benefit plan assets.
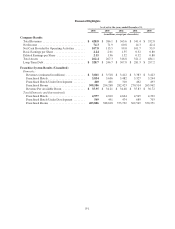
Summarized financial results for the years ended December 31, 2004 and 2003 are as follows:
2004 2003
(In thousands)
REVENUES:
Royalty fees .............................................................. $167,151 $151,326
Initial franchise and relicensing fees ........................................... 20,112 16,799
Partner services ........................................................... 12,524 13,227
Marketing and reservation ................................................... 221,313 195,420
Hotel operations .......................................................... 3,729 3,565
Other ................................................................... 3,977 5,767
Total revenues ........................................................ 428,806 386,104
OPERATING EXPENSES:
Selling, general and administrative ............................................ 69,654 62,860
Depreciation and amortization ............................................... 9,947 11,225
Marketing and reservation ................................................... 221,313 195,420
Hotel operations .......................................................... 2,892 2,616
Total operating expenses ................................................ 303,806 272,121
Operating income ......................................................... 125,000 113,983
Interest expense ........................................................... 11,605 11,597
Interest and other investment income .......................................... (1,093) (6,185)
Gain on prepayment of note receivable from Sunburst ............................ —(3,383)
Equity in net (income) losses of affiliates ....................................... (722) (582)
Loss on extinguishment of debt .............................................. 696 —
Other ................................................................... (10) 129
Total other income and expenses ......................................... 10,476 1,576
Income before income taxes ................................................. 114,524 112,407
Income taxes ............................................................. 40,179 40,544
Net income .............................................................. $ 74,345 $ 71,863
Weighted average shares outstanding-diluted .................................... 34,500 36,674
Diluted earnings per share ................................................... $ 2.15 $ 1.96
F-4