Comfort Inn 2004 Annual Report Download - page 11
Download and view the complete annual report
Please find page 11 of the 2004 Comfort Inn annual report below. You can navigate through the pages in the report by either clicking on the pages listed below, or by using the keyword search tool below to find specific information within the annual report.-
 1
1 -
 2
2 -
 3
3 -
 4
4 -
 5
5 -
 6
6 -
 7
7 -
 8
8 -
 9
9 -
 10
10 -
 11
11 -
 12
12 -
 13
13 -
 14
14 -
 15
15 -
 16
16 -
 17
17 -
 18
18 -
 19
19 -
 20
20 -
 21
21 -
 22
22 -
23
-
24
-
25
-
26
-
27
-
28
-
29
-
30
-
31
-
32
-
33
-
34
-
35
-
36
-
37
-
38
-
39
-
40
-
41
-
42
-
43
-
44
-
45
-
46
-
47
-
48
-
49
-
50
-
51
-
52
-
53
-
54
-
55
-
56
 |
 |
repurchases and dividends. In 1998, we instituted a share repurchase program which has generated substantial
value for our shareholders. We have repurchased 32.5 million shares of common stock at a total cost of $663
million, or an average price of $20.38 per share since the program’s inception. Our cash flows from operations
support our ability to complete the repurchase of approximately 1.8 million shares presently remaining under our
current board of director’s authorization. Upon completion of the current authorization we will evaluate the
propriety of additional share repurchases with our board of directors. In 2003, we initiated a cash dividend on our
common stock. During 2004, we paid dividends totaling approximately $27.7 million and we presently expect to
continue to pay dividends in the future. Based on our present dividend rate and outstanding share count,
aggregate annual dividends would be approximately $29.0 million.
We believe these value drivers, when properly implemented, will enhance our profitability, maximize our
financial returns and continue to generate value for our shareholders. The ultimate measure of our success will be
reflected in the items below.
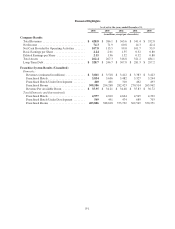
Results of Operation: Royalty fees, operating income, net income and diluted earnings per share represent
key measurements of these value drivers. In 2004, royalty fees revenue and operating income totaled
approximately $167.2 million and $125.0 million respectively, increases of approximately 10% from 2003. Net
income for the year ended December 31, 2004 increased to $74.3 million, an increase of $2.4 million over the
year ended December 31, 2003. Diluted earnings per share were $2.15, a 10% improvement over 2003 resulting
from increased net income and a reduction in the number of shares outstanding attributable to our share
repurchase program. Net income and diluted earnings per share in 2004 include a loss on extinguishment of debt
of approximately $0.7 million ($0.4 million, net of the related tax effect) related to the refinancing of the
Company’s senior credit facility. Net income and diluted earnings per share for the year ended December 31,
2003 include a $3.4 million gain and $4.5 million ($2.8 million, net of the related tax effect) of interest income
attributable to a note receivable from Sunburst Hospitality Corporation (“Sunburst”), which was repaid to the
Company in December 2003. These measurements will continue to be a key management focus in 2005 and
beyond.
Refer to MD&A heading “Operations Review” for additional analysis of our results.
Liquidity and Capital Resources: The Company generates significant cash flows from operations.In 2004
and 2003, net cash provided by operating activities was $107.8 million and $115.5 million, respectively. Since
our business does not require significant reinvestment of capital, we utilize cash in ways that management
believes provide the greatest returns to our shareholders which include share repurchases and dividends. We
believe the Company’s cash flow from operations and available financing capacity are sufficient to meet the
expected future operating, investing and financing needs of the business.
Refer to MD&A heading “Liquidity and Capital Resources” for additional analysis.
The principal factors that affect the Company’s results are: the number and relative mix of franchised hotels;
growth in the number of hotels under franchise; occupancy and room rates achieved by the hotels under
franchise; the effective royalty rate achieved; and our ability to manage costs. The number of rooms at franchised
properties and occupancy and room rates at those properties significantly affect the Company’s results because
our fees are based upon room revenues at franchised hotels. The key industry standard for measuring hotel-
operating performance is revenue per available room (“RevPAR”), which is calculated by multiplying the
percentage of occupied rooms by the average daily room rate realized. Our variable overhead costs associated
with franchise system growth have historically been less than incremental royalty fees generated from new
franchises. Accordingly, continued growth of our franchise business should enable us to realize benefits from the
operating leverage in place and improve operating results.
F-3