Citrix 2014 Annual Report Download - page 2
Download and view the complete annual report
Please find page 2 of the 2014 Citrix annual report below. You can navigate through the pages in the report by either clicking on the pages listed below, or by using the keyword search tool below to find specific information within the annual report.-
 1
1 -
 2
2 -
 3
3 -
 4
4 -
 5
5 -
 6
6 -
 7
7 -
 8
8 -
 9
9 -
 10
10 -
 11
11 -
 12
12 -
 13
13 -
14
-
15
-
16
-
17
-
18
-
19
-
20
-
21
-
22
-
23
-
24
-
25
-
26
-
27
-
28
-
29
-
30
-
31
-
32
-
33
-
34
-
35
-
36
-
37
-
38
-
39
-
40
-
41
-
42
-
43
-
44
-
45
-
46
-
47
-
48
-
49
-
50
-
51
-
52
-
53
-
54
-
55
-
56
-
57
-
58
-
59
-
60
-
61
-
62
-
63
-
64
-
65
-
66
-
67
-
68
-
69
-
70
-
71
-
72
-
73
-
74
-
75
-
76
-
77
-
78
-
79
-
80
-
81
-
82
-
83
-
84
-
85
-
86
-
87
-
88
-
89
-
90
-
91
-
92
-
93
-
94
-
95
-
96
-
97
-
98
-
99
-
100
-
101
-
102
-
103
-
104
-
105
-
106
-
107
-
108
-
109
-
110
-
111
-
112
-
113
-
114
-
115
-
116
-
117
-
118
-
119
-
120
 |
 |

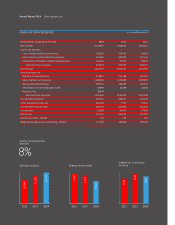
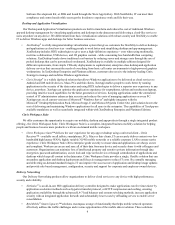
REVENUE (millions)
(In thousands, except per share data) 2014 2013 2012
Net revenues 3,142,856 2,918,434 2,586,123
Cost of net revenues:
Cost of product and license revenues 124,110 114,932 96,962
Cost of services and maintenance revenues 349,683 289,990 227,150
Amortization of product related intangible assets 146,426 97,873 80,025
Total cost of net revenues 620,219 502,795 404,137
Gross margin 2,522,637 2,415,639 2,181,986
Operating expenses:
Research and development 553,817 516,338 450,571
Sales, marketing and services 1,280,265 1,216,680 1,060,829
General and administrative 319,922 260,236 245,259
Amortization of other intangible assets 45,898 41,668 34,549
Restructuring 20,424 - -
Total operating expenses 2,220,326 2,034,922 1,791,208
Income from operations 302,311 380,717 390,778
Other (expense) income, net (26,605) 7,173 19,451
Income before income taxes 275,706 387,890 410,229
Income taxes 23,983 48,367 57,682
Net income 251,723 339,523 352,547
Earnings per share - diluted 1.47 1.80 1.86
Weighted average shares outstanding - diluted 171,270 188,245 189,129
IN 2014, CITRIX REVENUE
GREW BY
8%
$3,143
$2,586
$2,918
20142012 2013
20142012 2013
OPERATING CASH FLOW
(millions)
$846
$819
$928
EARNINGS PER SHARE
$1.47
$1.86
$1.80
20142012 2013
Annual Report 2014 Citrix Systems, Inc.
ANNUAL RETURN PERCENTAGE Year ended December 31