Cemex 2009 Annual Report Download - page 6
Download and view the complete annual report
Please find page 6 of the 2009 Cemex annual report below. You can navigate through the pages in the report by either clicking on the pages listed below, or by using the keyword search tool below to find specific information within the annual report.-
 1
1 -
 2
2 -
 3
3 -
 4
4 -
 5
5 -
 6
6 -
 7
7 -
 8
8 -
 9
9 -
 10
10 -
 11
11 -
 12
12 -
 13
13 -
 14
14 -
 15
15 -
 16
16 -
 17
17 -
18
-
19
-
20
-
21
-
22
-
23
-
24
-
25
-
26
-
27
-
28
-
29
-
30
-
31
-
32
-
33
-
34
-
35
-
36
-
37
-
38
-
39
-
40
-
41
-
42
-
43
-
44
-
45
-
46
-
47
-
48
-
49
-
50
-
51
-
52
-
53
-
54
-
55
-
56
-
57
-
58
-
59
-
60
-
61
-
62
-
63
-
64
-
65
-
66
-
67
-
68
-
69
-
70
-
71
-
72
-
73
-
74
-
75
-
76
-
77
-
78
-
79
-
80
-
81
-
82
-
83
-
84
-
85
-
86
-
87
-
88
-
89
-
90
-
91
-
92
-
93
-
94
 |
 |

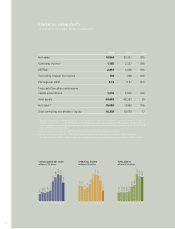
2009 2008 %
Net sales2 14,544 20,131 (28)
Operating income2 1,165 2,327 (50)
EBITDA2 2,657 4,080 (35)
Controlling interest net income 104 203 (49)
Earnings per ADS3 0.13 0.27 (51)
Free cash flow after maintenance
capital expenditures 1,215 2,600 (53)
Total assets 44,483 45,387 (2)
Net debt2,4 15,053 17,958 (16)
Total controlling stockholders’ equity 16,339 13,879 17
1 For your convenience, nominal Mexican peso results for 2009 and 2008 were translated to US dollars using the average ex-
change rate of the year of 13.60 MXN/US$ and 11.21 MXN/US$, respectively. For balance sheet accounts, US dollar amounts
were calculated by converting the peso amounts at the end of each year using the end-of-year exchange rate of 13.09 MXN/US$
and 13.74 MXN/US$, respectively.
2 Amounts have been adjusted to reflect the effect of the divestment of our Australian operations.
3 Based on an average of 854.8 and 766.1 million American depositary shares (ADSs) for 2009 and 2008, respectively.
4 As of December 31, 2008, net debt includes the fair value of cross currency swaps associated with debt for US$114 million.
FINANCIAL HIGHLIGHTS
(in millions of US dollars1, except per-ADS data)
CONSOLIDATED NET SALES
millions of US dollars
00 01 02 03 04 05 06 07 08 09
20,131
20,893
18,249
15,321
8,149
7,164
6,543
6,923
5,621
14,544
OPERATING INCOME
millions of US dollars
00 01 02 03 04 05 06 07 08 09
2,327
2,895
2,945
2,487
1,852
1,455
1,310
1,653
1,654
1,165
TOTAL ASSETS
millions of US dollars
00 01 02 03 04 05 06 07 08 09
45,387
49,662
29,972
26,763
17,381
16,016
15,934
16,230
15,759
44,483
4