Cemex 2009 Annual Report Download - page 14
Download and view the complete annual report
Please find page 14 of the 2009 Cemex annual report below. You can navigate through the pages in the report by either clicking on the pages listed below, or by using the keyword search tool below to find specific information within the annual report.-
 1
1 -
2
-
3
-
 4
4 -
 5
5 -
 6
6 -
 7
7 -
 8
8 -
 9
9 -
 10
10 -
 11
11 -
 12
12 -
 13
13 -
 14
14 -
 15
15 -
 16
16 -
 17
17 -
 18
18 -
 19
19 -
 20
20 -
 21
21 -
 22
22 -
 23
23 -
 24
24 -
25
-
26
-
27
-
28
-
29
-
30
-
31
-
32
-
33
-
34
-
35
-
36
-
37
-
38
-
39
-
40
-
41
-
42
-
43
-
44
-
45
-
46
-
47
-
48
-
49
-
50
-
51
-
52
-
53
-
54
-
55
-
56
-
57
-
58
-
59
-
60
-
61
-
62
-
63
-
64
-
65
-
66
-
67
-
68
-
69
-
70
-
71
-
72
-
73
-
74
-
75
-
76
-
77
-
78
-
79
-
80
-
81
-
82
-
83
-
84
-
85
-
86
-
87
-
88
-
89
-
90
-
91
-
92
-
93
-
94
 |
 |

1999 2000 2001 2002 2003 2004 2005 2006
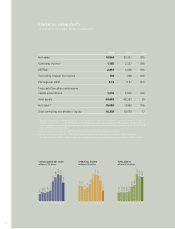
OPERATING RESULTS
Net sales 4,828 5,621 6,923 6,543 7,164 8,149 15,321 18,249
Cost of sales(1)(2) (2,690) (3,141) (3,894) (3,656) (4,130) (4,586) (9,271) (11,649)
Gross profit 2,138 2,480 3,029 2,888 3,034 3,563 6,050 6,600
Operating expenses(2) (702) (826) (1,376) (1,577) (1,579) (1,711) (3,563) (3,655)
Operating income 1,436 1,654 1,653 1,310 1,455 1,852 2,487 2,945
Other expenses, net(3) (334) (270) (441) (425) (474) (514) (316) (49)
Financial expense (488) (467) (412) (333) (381) (372) (526) (494)
Financial income 31 25 41 45 17 23 39 46
Comprehensive financing result(4) (29) (174) 265 (329) (267) 133 239 (32)
Income before taxes 1,136 1,271 1,522 617 766 1,541 2,495 2,989
Discontinued operations(5) - - - - - - - -
Non-controlling interest(6)(7)(8)(9) 56 78 153 37 30 21 55 110
Controlling interest net income 973 999 1,178 520 629 1,307 2,112 2,378
Millions of ADSs outstanding(10)(11) 546 556 584 608 648 678 704 733
Earnings per ADS from continued
operations(5)(11)(12) 1.94 1.83 2.07 0.87 1.00 1.96 3.05 3.31
Dividends per ADS(10)(11)(13) 0.40 0.49 0.51 0.52 0.51 0.61 0.60 0.90
BALANCE SHEET INFORMATION
Cash and temporary investments 326 308 428 361 291 342 601 1,579
Net working capital(14) 669 813 933 699 576 525 1,268 887
Property, plant, and equipment, net 6,922 9,034 8,940 8,963 9,265 9,613 15,542 17,196
Total assets 11,864 15,759 16,230 15,934 16,016 17,381 26,763 29,972
Short-term debt 1,030 2,962 1,028 1,393 1,329 1,044 1,191 1,252
Long-term debt 3,341 2,709 4,345 4,374 4,537 4,887 8,287 6,290
Total liabilities 5,430 8,111 8,078 8,983 9,250 9,161 16,409 15,193
Non-controlling interest(6)(7)(8)(9) 1,253 2,398 1,975 1,207 532 389 529 1,920
Total controlling stockholders’ equity 5,182 5,251 6,177 5,744 6,234 7,831 9,825 12,859
Total stockholders’ equity 6,435 7,649 8,152 6,951 6,766 8,220 10,354 14,779
Book value per ADS(10)(11) 9.48 9.45 10.58 8.63 8.78 11.55 13.94 17.55
OTHER FINANCIAL DATA
Operating margin 29.80% 29.40% 23.90% 20.00% 20.30% 22.70% 16.20% 16.10%
EBITDA margin(14) 37.10% 36.10% 32.60% 29.30% 29.40% 31.10% 23.20% 22.70%
EBITDA(14) 1,791 2,030 2,256 1,917 2,108 2,538 3,557 4,138
Free cash flow(14)(15) 860 886 1,145 948 1,143 1,478 2,198 2,689
SELECTED CONSOLIDATED
In millions of US dollars, except ADSs and per-ADS amounts
CEMEX, S.A.B. DE C.V. AND SUBSIDIARIES
12