Cemex 2009 Annual Report Download - page 16
Download and view the complete annual report
Please find page 16 of the 2009 Cemex annual report below. You can navigate through the pages in the report by either clicking on the pages listed below, or by using the keyword search tool below to find specific information within the annual report.-
 1
1 -
2
-
3
-
4
-
5
-
 6
6 -
 7
7 -
 8
8 -
 9
9 -
 10
10 -
 11
11 -
 12
12 -
 13
13 -
 14
14 -
 15
15 -
 16
16 -
 17
17 -
 18
18 -
 19
19 -
 20
20 -
 21
21 -
 22
22 -
 23
23 -
 24
24 -
 25
25 -
 26
26 -
27
-
28
-
29
-
30
-
31
-
32
-
33
-
34
-
35
-
36
-
37
-
38
-
39
-
40
-
41
-
42
-
43
-
44
-
45
-
46
-
47
-
48
-
49
-
50
-
51
-
52
-
53
-
54
-
55
-
56
-
57
-
58
-
59
-
60
-
61
-
62
-
63
-
64
-
65
-
66
-
67
-
68
-
69
-
70
-
71
-
72
-
73
-
74
-
75
-
76
-
77
-
78
-
79
-
80
-
81
-
82
-
83
-
84
-
85
-
86
-
87
-
88
-
89
-
90
-
91
-
92
-
93
-
94
 |
 |

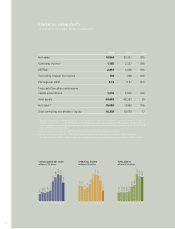
GLOBAL OPERATIONS
as of December 31, 2009
CEMENT PRODUCTION CEMENT CEMENT LAND
CAPACITY MILLION PLANTS PLANTS READY-MIX AGGREGATES DISTRIBUTION MARINE
METRIC TONS/YEAR CONTROLLED MINORITY PART. PLANTS QUARRIES CENTERS TERMINALS
Mexico 29.3 15 3 326 16 84 7
USA1 17.9 14 5 524 95 42 6
Spain 11.0 8 0 102 27 8 15
UK 2.8 3 0 235 59 15 5
Rest of Europe2 12.4 8 1 646 162 43 22
South / Central America and
Caribbean3 12.8 11 3 87 18 15 11
Africa & Middle East4 5.4 1 0 77 10 7 1
Asia5 5.7 3 0 19 4 9 5
Total 97.3 63 12 2,016 391 223 72
1 Includes operations from joint venture with Ready Mix USA
2 Includes operations in Austria, Croatia, Czech Republic, Finland, France, Germany, Hungary, Ireland, Latvia, Lithuania, Norway, Poland,
and Sweden
3 Includes operations in Argentina, Colombia, Costa Rica, the Dominican Republic, Guatemala, Nicaragua, Panama, Puerto Rico, as well as
other operations in the Caribbean region
4 Includes operations in Egypt, Israel, and the United Arab Emirates
5 Includes operations in Bangladesh, China, Malaysia, the Philippines, Taiwan, and Thailand
l CEMENT
l READY-MIX CONCRETE
l AGGREGATES
l OTHERS
l CEMENT
l READY-MIX CONCRETE
l AGGREGATES
l OTHERS
46
37
14 3
80
6
10 4
SALES DISTRIBUTION BY PRODUCT
percentage
EBITDA DISTRIBUTION BY PRODUCT
percentage
14