Cemex 2009 Annual Report Download - page 15
Download and view the complete annual report
Please find page 15 of the 2009 Cemex annual report below. You can navigate through the pages in the report by either clicking on the pages listed below, or by using the keyword search tool below to find specific information within the annual report.-
 1
1 -
2
-
3
-
4
-
 5
5 -
 6
6 -
 7
7 -
 8
8 -
 9
9 -
 10
10 -
 11
11 -
 12
12 -
 13
13 -
 14
14 -
 15
15 -
 16
16 -
 17
17 -
 18
18 -
 19
19 -
 20
20 -
 21
21 -
 22
22 -
 23
23 -
 24
24 -
 25
25 -
26
-
27
-
28
-
29
-
30
-
31
-
32
-
33
-
34
-
35
-
36
-
37
-
38
-
39
-
40
-
41
-
42
-
43
-
44
-
45
-
46
-
47
-
48
-
49
-
50
-
51
-
52
-
53
-
54
-
55
-
56
-
57
-
58
-
59
-
60
-
61
-
62
-
63
-
64
-
65
-
66
-
67
-
68
-
69
-
70
-
71
-
72
-
73
-
74
-
75
-
76
-
77
-
78
-
79
-
80
-
81
-
82
-
83
-
84
-
85
-
86
-
87
-
88
-
89
-
90
-
91
-
92
-
93
-
94
 |
 |

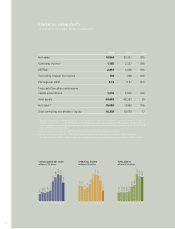
Notes to Selected Consolidated Financial Information
1. Cost of sales includes depreciation.
2. For the periods ending December 31, 2002 through 2007, and partially during 2001, the expenses
related to the distribution of the company’s products were classified as selling expenses on the income
statement. Partially during 2001 and fully between the years 1999 and 2000, such expenses were
recognized as part of cost of sales.
3. In accordance with Mexican Financial Reporting Standards (“MFRS”), starting from 2007 new presenta-
tion requirements apply for the income statement. For the purposes of the table, the years from 1999
through 2006 have been adjusted to comply with the new presentation requirements for 2007.
4. Comprehensive financing result includes financial expense, financial income, realized and unrealized
gains and losses on derivative financial instruments and marketable securities, foreign exchange
results, and the net monetary position result.
5. In October 2009, we completed the sale of our Australian operations for approximately A$2,020 million
(approx. US$1,700 million). The consolidated income statements present the results of operations of
the Australian assets, net of income tax, for the years 2007, 2008, and 2009 in a single line item as
“Discontinued Operations” (see note 4B to the 2009 Annual Report’s Financial Statements).
6. During 1995 and until August 2000, a minority interest was created in the consolidated stockholders’
equity due to a financial transaction implying the ownership transfer of 24.77% of the common stock
of CEMEX España. Such shares were treated as owned by a third party, although CEMEX retained
dividends and voting rights over such shares during the life of the transaction.
7. In 2000 a Dutch subsidiary of CEMEX issued preferred stock for US$1.5 billion in connection with the
financing required for the CEMEX, Inc. (formerly Southdown) acquisition. After redemptions of preferred
stock made during the life of this transaction, the outstanding amount of preferred stock included as
minority interest as of December 31, 2000, 2001, and 2002, was US$1,500 million, US$900 million, and
US$650 million, respectively. In October 2003, CEMEX early redeemed the total outstanding amount of
the preferred stock.
8. In 1998 a subsidiary of CEMEX in Spain issued US$250 million of capital securities. In April 2002,
through a tender offer, US$184 million of capital securities were redeemed. The balance outstanding as
of December 31, 2003 and 2002, was US$66 million and was liquidated during 2004. This transaction
was recorded as minority interest during its validity.
9. As of December 31, 2006, 2007, 2008, and 2009 non-controlling interest includes US$1,250 million,
US$3,065 million, US$3,020 million, and US$3,045 million, respectively, of aggregate notional amount
of perpetual debentures issued by consolidated entities. For accounting purposes, these debentures
represent equity instruments (see note 17D to the 2009 Annual Report’s Financial Statements).
10. The number of ADSs outstanding represents the total ADS equivalent units outstanding at the close
of each year, stated in millions of ADSs, and includes the total number of ADS equivalents issued by
CEMEX in underlying derivative transactions, and excludes the total number of ADS equivalents issued
by CEMEX and owned by subsidiaries. Each ADS listed on the New York Stock Exchange represents 10
CPOs.
11. Our shareholders approved stock splits in 2006, 2005, and 1999. As a result, each of our existing series
A shares was surrendered in exchange for two new series A shares, each of our existing series B
shares was surrendered in exchange for two new series B shares, and each of our existing CPOs was
surrendered in exchange for two new CPOs, with each new CPO representing two new series A shares
and one new series B. The proportional equity interest participation of the stockholders in CEMEX’s
common stock did not change as a result of the exchange offer and the stock splits mentioned above.
The number of our outstanding ADSs did not change as a result of the stock splits of the years 2005
and 1999. Instead, the ratio of CPOs to ADSs was modified so that each ADS represented 10 new
CPOs; as a result of the stock split approved during 2006, one additional ADS was issued in exchange
for each existing ADS, each ADS representing 10 new CPOs. Earnings per ADS and the number of
ADSs outstanding for the years ended December 31, 1999 through 2005, have been adjusted to make
the effect of the stock splits retroactive for the correspondent years. In order to comply with Mexico’s
accounting principles, in the Financial Statements these figures are presented on a per-share basis (see
note 19 to the 2007 Annual Report’s Financial Statements).
12. For the periods ended December 31, 1999 through 2009, the earnings-per-ADS amounts were deter-
mined by considering the average number of ADS equivalent units outstanding during each year, i.e.,
549.8, 568.6, 598.3, 630.4, 665.8, 691.9, 718.4, 743.2, 766.2, and 854.8 million, respectively.
13. Dividends declared at each year’s annual stockholders’ meeting for each period are reflected as
dividends for the preceding year. We did not declare a dividend for the year 2008, instead, at our 2009
annual shareholders’ meeting, a recapitalization of retained earnings was approved. New CPOs issued
pursuant to the recapitalization were allocated to shareholders on a pro-rata basis. As a result, shares
equivalent to approximately 334 million CPOs were issued and paid. CPO holders received one new
CPO for each 25 CPOs held, and ADS holders received one new ADS for each 25 ADSs held. There was
no cash distribution and no entitlement to fractional shares.
14. Please refer to page 87 for the definition of terms.
15. Beginning in 2005, free cash flow is calculated after maintenance capital expenditures only.
13
Compounded
annual growth
2007 2008 2009 08–09 99–09
20,893 20,131 14,544 (28%) 12%
(13,868) (13,735) (10,270)
7,025 6,396 4,274
(4,130) (4,069) (3,109)
2,895 2,327 1,165 (50%) (2%)
(273) (1,909) (407)
(807) (910) (994)
75 46 28
93 (2,527) (1,111)
2,851 (2,031) (341)
26 187 (314)
77 4 18
2,391 203 104 (49%) (20%)
751 777 960
3.21 0.27 0.13 (51%) (24%)
0.83 n.a n.a
743 939 1,077
1,383 1,191 946
22,895 19,671 19,776
49,662 45,387 44,483
3,311 6,934 565
16,542 11,849 15,565
30,967 28,119 24,806
3,753 3,390 3,338
14,942 13,879 16,339
18,695 17,268 19,677
19.90 17.85 17.03
13.85% 11.56% 8.01%
21.60% 20.29% 18.28%
4,512 4,080 2,657 (35%) 4%
2,455 2,600 1,215 (53%) 4%