Cathay Pacific 2005 Annual Report Download - page 20
Download and view the complete annual report
Please find page 20 of the 2005 Cathay Pacific annual report below. You can navigate through the pages in the report by either clicking on the pages listed below, or by using the keyword search tool below to find specific information within the annual report.-
 1
1 -
2
-
3
-
4
-
5
-
6
-
7
-
8
-
9
-
 10
10 -
 11
11 -
 12
12 -
 13
13 -
 14
14 -
 15
15 -
 16
16 -
 17
17 -
 18
18 -
 19
19 -
 20
20 -
 21
21 -
 22
22 -
 23
23 -
 24
24 -
 25
25 -
 26
26 -
 27
27 -
 28
28 -
 29
29 -
 30
30 -
31
-
32
-
33
-
34
-
35
-
36
-
37
-
38
-
39
-
40
-
41
-
42
-
43
-
44
-
45
-
46
-
47
-
48
-
49
-
50
-
51
-
52
-
53
-
54
-
55
-
56
-
57
-
58
-
59
-
60
-
61
-
62
-
63
-
64
-
65
-
66
-
67
-
68
-
69
-
70
-
71
-
72
-
73
-
74
-
75
-
76
-
77
-
78
-
79
-
80
-
81
-
82
-
83
-
84
-
85
-
86
-
87
-
88
-
89
-
90
-
91
-
92
-
93
-
94
-
95
-
96
 |
 |

18 Cathay Pacific Airways Limited Annual Report 2005
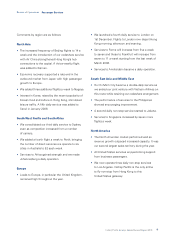
Cathay Pacific: total net operating expenses
14%
Depreciation and
operating leases
21%
Staff
11%
Aircraft
maintenance
1%
Net finance
charges
3%
Others
1%
Commissions
29%
Fuel
15%
Landing, parking
and route expenses
5%
Inflight service and
passenger expenses
Cathay Pacific: fuel price and consumption
2001 2002 2003 2004 2005
US cents per
American gallon
Into plane price – after hedging
Into plane price – before hedging
American gallons
in million
Uplifted volume
0
50
100
150
200
0
500
1,000
1,500
2,000
Financial Review
Operating expenses
Net operating expenses after deduction of Group recoveries HK$6,446 million (2004: HK$3,696 million) and of
Cathay Pacific recoveries HK$6,529 million (2004: HK$3,774 million) are analysed as follows:
Group Cathay Pacific
2005 2004 2005 2004
HK$M HK$M Change HK$M HK$M Change
Staff 9,025 8,842 +2.1% 8,132 7,985 +1.8%
Inflight service and passenger expenses 1,783 1,566 +13.9% 1,783 1,566 +13.9%
Landing, parking and route expenses 5,977 5,324 +12.3% 5,832 5,209 +12.0%
Fuel 11,640 7,836 +48.5% 11,400 7,704 +48.0%
Aircraft maintenance 4,527 3,784 +19.6% 4,459 3,768 +18.3%
Aircraft depreciation and operating leases 4,882 4,356 +12.1% 4,755 4,206 +13.1%
Other depreciation and operating leases 790 814 -2.9% 590 595 -0.8%
Commissions 555 529 +4.9% 555 529 +4.9%
Exchange gain (156) (199) -21.6% (148) (201) -26.4%
Others 1,297 966 +34.3% 1,147 820 +39.9%
Net operating expenses 40,320 33,818 +19.2% 38,505 32,181 +19.7%
Net finance charges 444 583 -23.8% 361 556 -35.1%
Total net operating expenses 40,764 34,401 +18.5% 38,866 32,737 +18.7%