Cathay Pacific 2005 Annual Report Download - page 19
Download and view the complete annual report
Please find page 19 of the 2005 Cathay Pacific annual report below. You can navigate through the pages in the report by either clicking on the pages listed below, or by using the keyword search tool below to find specific information within the annual report.-
 1
1 -
2
-
3
-
4
-
5
-
6
-
7
-
8
-
 9
9 -
 10
10 -
 11
11 -
 12
12 -
 13
13 -
 14
14 -
 15
15 -
 16
16 -
 17
17 -
 18
18 -
 19
19 -
 20
20 -
 21
21 -
 22
22 -
 23
23 -
 24
24 -
 25
25 -
 26
26 -
 27
27 -
 28
28 -
 29
29 -
30
-
31
-
32
-
33
-
34
-
35
-
36
-
37
-
38
-
39
-
40
-
41
-
42
-
43
-
44
-
45
-
46
-
47
-
48
-
49
-
50
-
51
-
52
-
53
-
54
-
55
-
56
-
57
-
58
-
59
-
60
-
61
-
62
-
63
-
64
-
65
-
66
-
67
-
68
-
69
-
70
-
71
-
72
-
73
-
74
-
75
-
76
-
77
-
78
-
79
-
80
-
81
-
82
-
83
-
84
-
85
-
86
-
87
-
88
-
89
-
90
-
91
-
92
-
93
-
94
-
95
-
96
 |
 |

17
Cathay Pacific Airways Limited Annual Report 2005
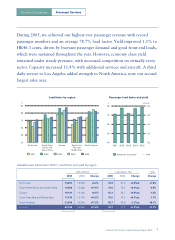
Revenue and breakeven load factor
2001 2002 2003 2004 2005
%
Breakeven load factor
Revenue load factor
50
55
60
65
70
75
80
• Group turnover rose by 19.1% on 2004.
• Passenger turnover increased significantly by 14.6%
to HK$30,274 million as a result of strong demand.
The number of passengers carried increased by
13.0% to 15.4 million and revenue passenger
kilometres increased by 13.7%.
• Passenger load factor increased by 1.4 percentage
points to 78.7% while capacity, in terms of available
seat kilometres, increased by 11.8%.
• Passenger yield increased by 1.1% to HK¢46.3.
• First and business class revenues increased by
19.1% and the front-end load factor increased from
63.1% to 66.0%. Economy class revenue increased
by 12.5% and the economy class load factor
increased from 80.0% to 80.9%.
• Cathay Pacific’s cargo turnover increased by 9.8%
to HK$11,585 million as the demand of exports
from Mainland China through Hong Kong remained
strong though slowed in the second half in the face
of high fuel prices.
• Cathay Pacific’s cargo load factor decreased by
1.7 percentage points while capacity increased by
12.9%. Cargo yield decreased by 0.6% to HK$1.75.
• The improvement in Cathay Pacific’s traffic turnover
can be analysed as follows:
HK$M
+11.8% Passenger capacity 3,086
+12.9% Cargo and mail capacity 1,364
+1.4%pt Passenger load factor 501
-1.7%pt Cargo and mail load factor (291)
+1.1% Passenger yield 279
-0.6% Cargo and mail yield (36)
4,903
• Revenue load factor increased by 0.4 percentage
points to 75.2% while the breakeven load factor
increased by 3.8 percentage points to 69.3%.
• The annualised revenue effect on changes in yield
and load factor is set out below:
HK$M
+ 1 percentage point in 383
passenger load factor
+ 1 percentage point in 173
cargo and mail load factor
+ HK¢1 in passenger yield 651
+ HK¢1 in cargo and mail yield 66
Financial Review