Casio 2015 Annual Report Download - page 19
Download and view the complete annual report
Please find page 19 of the 2015 Casio annual report below. You can navigate through the pages in the report by either clicking on the pages listed below, or by using the keyword search tool below to find specific information within the annual report.-
 1
1 -
2
-
3
-
4
-
5
-
6
-
7
-
8
-
 9
9 -
 10
10 -
 11
11 -
 12
12 -
 13
13 -
 14
14 -
 15
15 -
 16
16 -
 17
17 -
 18
18 -
 19
19 -
 20
20 -
 21
21 -
 22
22 -
 23
23 -
 24
24 -
 25
25 -
 26
26 -
 27
27 -
 28
28 -
 29
29 -
30
-
31
-
32
-
33
-
34
-
35
-
36
-
37
-
38
-
39
-
40
-
41
-
42
-
43
-
44
 |
 |

Financial Section
Management
Foundation Corporate Data
Annual Report 2015 CONTENTS / 4218
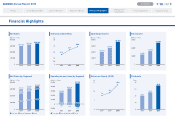
Prole To Our Stakeholders Casio's Strength Special Features Financial Highlights
Consolidated Five-Year Summary
Years ended March 31 Casio Computer Co., Ltd. and Consolidated Subsidiaries
Millions of Yen
2015 2014 2013 2012 2011
For the year:
Net sales ............................................................................................................................................. ¥338,389 ¥321,761 ¥297,763 ¥301,660 ¥341,678
Cost of sales ....................................................................................................................................... 190,706 189,358 181,479 195,622 227,923
Selling, general and administrative expenses ........................................................................................ 103,733 97,475 88,313 89,559 93,875
Research and development expenses .................................................................................................. 7,187 8,352 7,918 7,414 7,838
Operating income ................................................................................................................................ 36,763 26,576 20,053 9,065 12,042
Net income ......................................................................................................................................... 26,400 15,989 11,876 2,556 5,682
Comprehensive income ....................................................................................................................... 38,628 24,072 19,544 594 1,742
Capital investment ............................................................................................................................... 5,926 5,574 7,637 6,678 6,183
Depreciation on property, plant and equipment ..................................................................................... 5,794 5,717 5,325 6,060 7,674
At year-end:
Current assets ..................................................................................................................................... 244,614 244,135 249,719 244,022 269,150
Current liabilities .................................................................................................................................. 82,306 122,110 115,302 91,585 117,886
Working capital ................................................................................................................................... 162,308 122,025 134,417 152,437 151,264
Net assets ........................................................................................................................................... 204,158 185,256 163,968 149,254 153,232
Total assets ......................................................................................................................................... 374,656 366,964 369,322 366,212 402,456
Amounts per share of common shares (in yen):
Net income ......................................................................................................................................... 100.08 59.47 44.17 9.51 20.90
Diluted net income............................................................................................................................... 98.77 59.45 44.15 8.68 19.10
Cash dividends applicable to the year .................................................................................................. 35.00 25.00 20.00 17.00 17.00
(Interim dividends) ............................................................................................................................... (12.50) (10.00) (—) (—) (—)
Performance indicators:
Return on equity (%) ............................................................................................................................ 13.6 9.2 7.6 1.7 3.6
Return on assets (%) ........................................................................................................................... 7.1 4.3 3.2 0.7 1.4
Equity ratio (%) .................................................................................................................................... 54.5 50.5 44.4 40.7 38.0
Interest coverage (times) ...................................................................................................................... 42.6 22.9 17.4 10.3 15.9
Assets turnover (times) ........................................................................................................................ 0.9 0.9 0.8 0.8 0.8
Inventory turnover (months) .................................................................................................................. 3.5 3.0 3.6 2.8 2.4
Other:
Number of employees .......................................................................................................................... 11,592 10,992 11,276 11,663 11,522