Casio 2015 Annual Report Download - page 11
Download and view the complete annual report
Please find page 11 of the 2015 Casio annual report below. You can navigate through the pages in the report by either clicking on the pages listed below, or by using the keyword search tool below to find specific information within the annual report.-
 1
1 -
 2
2 -
 3
3 -
 4
4 -
 5
5 -
 6
6 -
 7
7 -
 8
8 -
 9
9 -
 10
10 -
 11
11 -
 12
12 -
 13
13 -
 14
14 -
 15
15 -
 16
16 -
 17
17 -
 18
18 -
 19
19 -
 20
20 -
 21
21 -
 22
22 -
23
-
24
-
25
-
26
-
27
-
28
-
29
-
30
-
31
-
32
-
33
-
34
-
35
-
36
-
37
-
38
-
39
-
40
-
41
-
42
-
43
-
44
 |
 |

2013 20152014
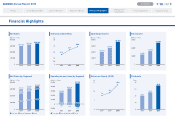
Net Sales
20152014
2013 20152014
227, 8 61
287,113
264,404
41,778
40,848
45,299
28,124
10,428
12,058
47,13 0
35,504
-5,692-1,765
-219
-512
20152014
2013 20152014
2013 20152014
■Consumer ■System Equipment ■Others ■Consumer ■System Equipment ■Others
(Millions of Yen) (Millions of Yen)
297,76 3
338,389
321,761
2013
26,554
-702
-293
2013
20,053
36,763
26,576
11,876
26,400
15,989
13.6
9.2
7.6
(Millions of Yen) (Millions of Yen) (Millions of Yen)
201520142013
20.0
35.0
25.0
(Yen)(%)
Operating Income Net Income
Net Sales by Segment
Operating Income (Loss) by Segment
Return on Equity (ROE) Dividends
0
5
10
15
0
10,000
20,000
30,000
0
10,000
20,000
30,000
40,000
0
100,000
200,000
300,000
400,000
2013 20152014
Overseas Sales Ratio
55.5
68.6
63.4
(%)
0
50
60
70
80
0
10
20
30
40
-10,000
0
10,000
20,000
30,000
40,000
50,000
0
100,000
200,000
300,000
400,000
Financial Section
Management
Foundation Corporate Data
Annual Report 2015 CONTENTS / 4210
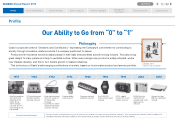
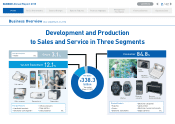
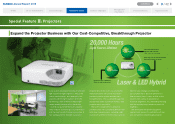
Prole To Our Stakeholders Casio's Strength Special Features Financial Highlights
Financial Highlights