Casio 2015 Annual Report Download - page 16
Download and view the complete annual report
Please find page 16 of the 2015 Casio annual report below. You can navigate through the pages in the report by either clicking on the pages listed below, or by using the keyword search tool below to find specific information within the annual report.-
 1
1 -
2
-
3
-
4
-
5
-
 6
6 -
 7
7 -
 8
8 -
 9
9 -
 10
10 -
 11
11 -
 12
12 -
 13
13 -
 14
14 -
 15
15 -
 16
16 -
 17
17 -
 18
18 -
 19
19 -
 20
20 -
 21
21 -
 22
22 -
 23
23 -
 24
24 -
 25
25 -
 26
26 -
27
-
28
-
29
-
30
-
31
-
32
-
33
-
34
-
35
-
36
-
37
-
38
-
39
-
40
-
41
-
42
-
43
-
44
 |
 |

Financial Section
Management
Foundation Corporate Data
Annual Report 2015 CONTENTS / 4215
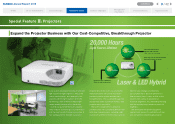
Prole To Our Stakeholders Casio's Strength Special Features Financial Highlights
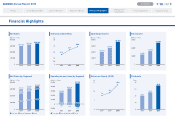
Net Sales
Consolidated net sales for the year ended March 31, 2015 increased 5.2% compared with the
previous fiscal year to ¥338,389 million.
(Millions of Yen)
2015 2014
Consumer .................................................................................. ¥287,113 ¥264,404
System Equipment ...................................................................... 40,848 45,299
Others ....................................................................................... 10,428 12,058
Total ...................................................................................... ¥338,389 ¥321,761
Sales by Segment
Consumer segment sales increased 8.6% compared with the previous fiscal year to ¥287,113
million, and accounted for 84.8% of net sales. In the timepiece business, sales of the high-end
G-SHOCK and OCEANUS lines, including the world’s first GPS hybrid radio-controlled solar-
powered watches, remained strong in Japan and overseas, driving substantial growth in overall
sales. In addition, sales of the EDIFICE model that connects to a smartphone via Bluetooth®
remained robust. Sales of calculators also rose, due largely to an expanded lineup of products
customized for local needs.
System Equipment segment sales decreased 9.8% compared with the previous fiscal year to
¥40,848 million. Others segment sales decreased 13.5% compared with the previous fiscal
year to ¥10,428 million.
Results of Operations
Operating income increased 38.3% compared with the previous fiscal year to ¥36,763 million.
Consumer segment income increased to ¥47,130 million because of the improved product mix
in the timepiece business, the expanded lineup of original high-end digital cameras, and the
launch of high-value-added calculators. System Equipment segment loss was ¥5,692 million.
Others segment loss was ¥219 million.
Net income increased 65.1% compared with the previous fiscal year to ¥26,400 million. Net
income per share increased 68.3% to a record ¥100.8.
Financial Condition
Total assets as of March 31, 2015 increased ¥7,692 million from a year earlier to ¥374,656
million, largely because securities increased. Total liabilities as of March 31, 2015 decreased
6.2% from a year earlier to ¥170,498 million. Current liabilities decreased ¥39,804 million to
¥82,306 million. Non-current liabilities increased ¥28,594 million to ¥88,192 million. Net assets
as of March 31, 2015 increased ¥18,902 million from a year earlier to ¥204,158 million due
mainly to an increase in retained earnings.
As a result, the equity ratio increased 4.0 percentage points to 54.5%.
Cash Flow Analysis
Net cash provided by operating activities decreased ¥9,352 million year on year to ¥30,755
million. This was mainly due to a decrease in working capital.
Net cash used in investing activities was ¥10,668 million, compared with net cash provided
by investing activities of ¥8,044 million for the previous year.
Net cash used in financing activities decreased ¥7,894 million year on year to ¥30,629 million.
As a result, cash and cash equivalents as of March 31, 2015 decreased ¥3,392 million from a
year earlier to ¥110,737 million. The Casio Group therefore has ample liquidity.
Capital Investment
Capital investment was ¥5,926 million. By segment, capital investment was ¥4,513 million in
the Consumer segment, ¥1,062 million in the System Equipment segment, and ¥231 million in
the Others segment.
Research & Development
R&D expenses were ¥7,187 million. By segment, R&D expenses were ¥3,545 million in the
Consumer segment, ¥748 million in the System Equipment segment, and ¥7 million in the
Others segment.
Management’s Discussion and Analysis