Casio 2014 Annual Report Download - page 7
Download and view the complete annual report
Please find page 7 of the 2014 Casio annual report below. You can navigate through the pages in the report by either clicking on the pages listed below, or by using the keyword search tool below to find specific information within the annual report.-
 1
1 -
 2
2 -
 3
3 -
 4
4 -
 5
5 -
 6
6 -
 7
7 -
 8
8 -
 9
9 -
 10
10 -
 11
11 -
 12
12 -
 13
13 -
 14
14 -
 15
15 -
 16
16 -
 17
17 -
 18
18 -
19
-
20
-
21
-
22
-
23
-
24
-
25
-
26
-
27
-
28
-
29
-
30
-
31
-
32
-
33
-
34
-
35
-
36
-
37
-
38
-
39
-
40
-
41
-
42
-
43
 |
 |

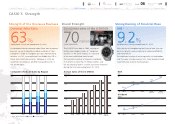
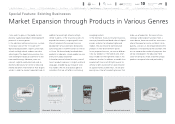
CASIO´S Strength
Overseas Sales Ratio
63%
(Performance in fiscal year ended March 31, 2014)
Strength of the Overseas Business
In the growth markets overseas where Casio aims to expand
business, we are strategically building a network of sales
companies in order to strengthen our sales and marketing
activities. In 2013, we established Casio Middle East FZE in
Dubai and started sales activities. Moreover, in 2014 we
launched Casio Malaysia, Sdn Bhd. to expand business in
the ASEAN region.
The G-SHOCK was born in 1983, creating an
entirely new category known as “toughness
watches” in the watch industry. It is now one
of the most established watch brands.
The cumulative number of shipments worldwide
of G-SHOCK is more than 70 million watches, and
we are aiming to reach 7.2 million cumulative shipments
during the fiscal year ending March 31, 2015.
With the aim of strengthening the financial base that sup-
ports our growth, we are working to increase profitability
and improve ROE.
We implement a policy of returning profits to shareholders,
and this policy includes payment of a stable dividend linked
to performance and also share buybacks.
Cumulative sales of the G-SHOCK
70million
(Fiscal 1984–2014)
Brand Strength
More than ROE
9.2%
(Performance in fiscal year ended March 31, 2014)
Strengthening of Financial Base
Japan North America Europe Asia and Others
7.5
6.0
4.5
3.0
1.5
02009 2010 2011 2012 2013 2014 2015
(Planned)
100
80
60
40
20
02011 2012 2013 2014
20
10
1.7%
7.6%
17%
12%
9.2%
02012 2013 2014 2015
(Planned)2016
(Planned)
17 20
25
25
10 2012 2013 2014
Component Ratio of Sales by Region
(%)
Annual Sales of the G-SHOCK
(million)
Dividend
(Yen)
ROE
(%)
Profile / Contents History To Our Stakeholders At a Glance Special Feature CSRCorporate Governance Financial Section
PAGE 06
Move back to
previous page
Move forward to
next page
Search
Print
Corporate DataCASIO’s Strength