Carnival Cruises 2010 Annual Report Download - page 8
Download and view the complete annual report
Please find page 8 of the 2010 Carnival Cruises annual report below. You can navigate through the pages in the report by either clicking on the pages listed below, or by using the keyword search tool below to find specific information within the annual report.-
 1
1 -
 2
2 -
 3
3 -
 4
4 -
 5
5 -
 6
6 -
 7
7 -
 8
8 -
 9
9 -
 10
10 -
 11
11 -
 12
12 -
 13
13 -
 14
14 -
 15
15 -
 16
16 -
 17
17 -
 18
18 -
 19
19 -
20
-
21
-
22
-
23
-
24
-
25
-
26
-
27
-
28
-
29
-
30
-
31
-
32
-
33
-
34
-
35
-
36
-
37
-
38
-
39
-
40
-
41
-
42
-
43
-
44
-
45
-
46
-
47
-
48
-
49
-
50
-
51
-
52
-
53
-
54
-
55
-
56
-
57
-
58
-
59
-
60
-
61
-
62
-
63
 |
 |

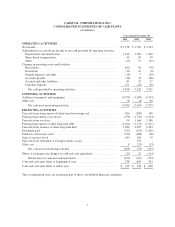
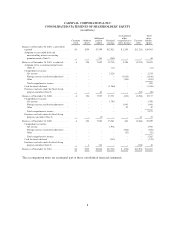
CARNIVAL CORPORATION & PLC
CONSOLIDATED STATEMENTS OF CASH FLOWS
(in millions)
Years Ended November 30,
2010 2009 2008
OPERATING ACTIVITIES
Net income ......................................................... $1,978 $ 1,790 $ 2,324
Adjustments to reconcile net income to net cash provided by operating activities
Depreciation and amortization ........................................ 1,416 1,309 1,249
Share-based compensation ........................................... 43 50 50
Other ............................................................ (15) 37 (31)
Changes in operating assets and liabilities
Receivables ....................................................... 106 81 (70)
Inventories ....................................................... (12) 10 (8)
Prepaid expenses and other .......................................... (14) 7 (18)
Accounts payable .................................................. (36) 74 (66)
Accrued and other liabilities ......................................... 81 29 37
Customer deposits ................................................. 271 (45) (76)
Net cash provided by operating activities ............................. 3,818 3,342 3,391
INVESTING ACTIVITIES
Additions to property and equipment ..................................... (3,579) (3,380) (3,353)
Other, net .......................................................... 78 (4) 98
Net cash used in investing activities ................................. (3,501) (3,384) (3,255)
FINANCING ACTIVITIES
Proceeds from (repayments of) short-term borrowings, net ................... 626 (288) 138
Principal repayments of revolvers ....................................... (350) (1,749) (3,314)
Proceeds from revolvers ............................................... 94 1,166 3,186
Principal repayments of other long-term debt .............................. (1,842) (1,273) (1,211)
Proceeds from issuance of other long-term debt ............................ 1,280 2,299 2,243
Dividends paid ...................................................... (237) (314) (1,261)
Purchases of treasury stock ............................................ (524) (188) (98)
Sales of treasury stock ................................................ 545 196 15
Proceeds from settlement of foreign currency swaps ........................ - 113 -
Other, net .......................................................... 4 (55) (13)
Net cash used in financing activities ................................. (404) (93) (315)
Effect of exchange rate changes on cash and cash equivalents ................. (22) 23 (114)
Net decrease in cash and cash equivalents ............................. (109) (112) (293)
Cash and cash equivalents at beginning of year ............................. 538 650 943
Cash and cash equivalents at end of year .................................. $ 429 $ 538 $ 650
The accompanying notes are an integral part of these consolidated financial statements.
7