Carnival Cruises 2010 Annual Report Download - page 2
Download and view the complete annual report
Please find page 2 of the 2010 Carnival Cruises annual report below. You can navigate through the pages in the report by either clicking on the pages listed below, or by using the keyword search tool below to find specific information within the annual report.-
 1
1 -
 2
2 -
 3
3 -
 4
4 -
 5
5 -
 6
6 -
 7
7 -
 8
8 -
 9
9 -
 10
10 -
 11
11 -
 12
12 -
 13
13 -
14
-
15
-
16
-
17
-
18
-
19
-
20
-
21
-
22
-
23
-
24
-
25
-
26
-
27
-
28
-
29
-
30
-
31
-
32
-
33
-
34
-
35
-
36
-
37
-
38
-
39
-
40
-
41
-
42
-
43
-
44
-
45
-
46
-
47
-
48
-
49
-
50
-
51
-
52
-
53
-
54
-
55
-
56
-
57
-
58
-
59
-
60
-
61
-
62
-
63
 |
 |

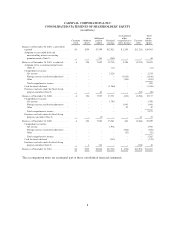
COMPANY
Carnival Corporation & plc is the largest and financially strongest cruise company and among the largest and
most profitable vacation companies in the world. Our mission is to deliver exceptional vacation experiences
through many of the world’s best-known cruise brands that cater to a variety of different geographic regions and
lifestyles, all at an outstanding value unrivalled on land or at sea.
Our portfolio of cruise brands in North America, Europe, Australia and Asia are comprised of Carnival Cruise
Lines, Holland America Line, Princess Cruises, Seabourn, AIDA Cruises, Costa Cruises, Cunard, Ibero Cruises,
P&O Cruises (UK) and P&O Cruises (Australia). Together, these brands operate 98 ships totaling more than
191,000 lower berths with 10 new ships scheduled to be delivered between March 2011 and May 2014. Carnival
Corporation & plc also operates Holland America Princess Alaska Tours, the leading tour company in Alaska
and the Canadian Yukon. Traded on both the New York and London Stock Exchanges, Carnival Corporation &
plc is the only group in the world to be included in both the S&P 500 and the FTSE 100 indices.
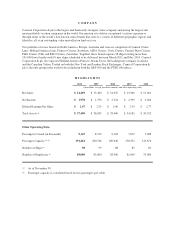
HIGHLIGHTS
2010 2009 2008 2007 2006
(in millions, except per share amounts and other operating data)
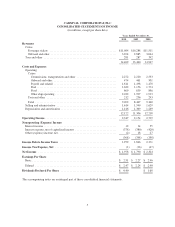
Revenues $ 14,469 $ 13,460 $ 14,947 $ 13,306 $ 12,061
Net Income $ 1,978 $ 1,790 $ 2,324 $ 2,395 $ 2,260
Diluted Earnings Per Share $ 2.47 $ 2.24 $ 2.90 $ 2.95 $ 2.77
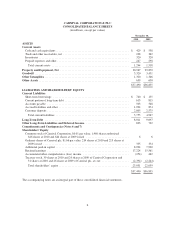
Total Assets (a) $ 37,490 $ 36,835 $ 33,400 $ 34,181 $ 30,552
Other Operating Data
Passengers Carried (in thousands) 9,147 8,519 8,183 7,672 7,008
Passenger Capacity (a) (b) 191,464 180,746 169,040 158,352 143,676
Number of Ships (a) 98 93 88 85 81
Number of Employees (a) 89,000 85,000 83,000 81,000 75,000
(a) As of November 30.
(b) Passenger capacity is calculated based on two passengers per cabin.