Carnival Cruises 2010 Annual Report Download - page 6
Download and view the complete annual report
Please find page 6 of the 2010 Carnival Cruises annual report below. You can navigate through the pages in the report by either clicking on the pages listed below, or by using the keyword search tool below to find specific information within the annual report.-
 1
1 -
 2
2 -
 3
3 -
 4
4 -
 5
5 -
 6
6 -
 7
7 -
 8
8 -
 9
9 -
 10
10 -
 11
11 -
 12
12 -
 13
13 -
 14
14 -
 15
15 -
 16
16 -
 17
17 -
18
-
19
-
20
-
21
-
22
-
23
-
24
-
25
-
26
-
27
-
28
-
29
-
30
-
31
-
32
-
33
-
34
-
35
-
36
-
37
-
38
-
39
-
40
-
41
-
42
-
43
-
44
-
45
-
46
-
47
-
48
-
49
-
50
-
51
-
52
-
53
-
54
-
55
-
56
-
57
-
58
-
59
-
60
-
61
-
62
-
63
 |
 |

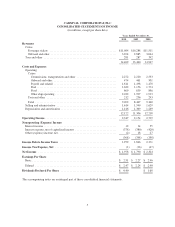
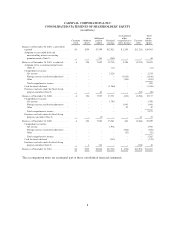
CARNIVAL CORPORATION & PLC
CONSOLIDATED STATEMENTS OF INCOME
(in millions, except per share data)
Years Ended November 30,
2010 2009 2008
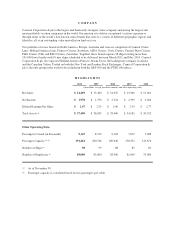
Revenues
Cruise
Passenger tickets ............................................... $11,084 $10,288 $11,511
Onboard and other .............................................. 3,104 2,885 3,044
Tour and other ................................................... 281 287 392
14,469 13,460 14,947
Costs and Expenses
Operating
Cruise
Commissions, transportation and other ............................ 2,272 2,220 2,533
Onboard and other ............................................ 474 461 501
Payroll and related ............................................ 1,611 1,498 1,470
Fuel ........................................................ 1,622 1,156 1,774
Food ....................................................... 869 839 856
Other ship operating ........................................... 2,032 1,997 1,913
Tour and other ................................................. 212 236 293
Total ......................................................... 9,092 8,407 9,340
Selling and administrative .......................................... 1,614 1,590 1,629
Depreciation and amortization ....................................... 1,416 1,309 1,249
12,122 11,306 12,218
Operating Income .................................................. 2,347 2,154 2,729
Nonoperating (Expense) Income
Interest income ................................................... 12 14 35
Interest expense, net of capitalized interest ............................. (378) (380) (420)
Other (expense) income, net ......................................... (2) 18 27
(368) (348) (358)
Income Before Income Taxes ........................................ 1,979 1,806 2,371
Income Tax Expense, Net ........................................... (1) (16) (47)
Net Income ....................................................... $ 1,978 $ 1,790 $ 2,324
Earnings Per Share
Basic ........................................................... $ 2.51 $ 2.27 $ 2.96
Diluted ......................................................... $ 2.47 $ 2.24 $ 2.90
Dividends Declared Per Share ....................................... $ 0.40 $ 1.60
The accompanying notes are an integral part of these consolidated financial statements.
5