Boeing 2010 Annual Report Download - page 6
Download and view the complete annual report
Please find page 6 of the 2010 Boeing annual report below. You can navigate through the pages in the report by either clicking on the pages listed below, or by using the keyword search tool below to find specific information within the annual report.-
 1
1 -
 2
2 -
 3
3 -
 4
4 -
 5
5 -
 6
6 -
 7
7 -
 8
8 -
 9
9 -
 10
10 -
 11
11 -
 12
12 -
 13
13 -
 14
14 -
 15
15 -
 16
16 -
 17
17 -
18
-
19
-
20
-
21
-
22
-
23
-
24
-
25
-
26
-
27
-
28
-
29
-
30
-
31
-
32
-
33
-
34
-
35
-
36
-
37
-
38
-
39
-
40
-
41
-
42
-
43
-
44
-
45
-
46
-
47
-
48
-
49
-
50
-
51
-
52
-
53
-
54
-
55
-
56
-
57
-
58
-
59
-
60
-
61
-
62
-
63
-
64
-
65
-
66
-
67
-
68
-
69
-
70
-
71
-
72
-
73
-
74
-
75
-
76
-
77
-
78
-
79
-
80
-
81
-
82
-
83
-
84
-
85
-
86
-
87
-
88
-
89
-
90
-
91
-
92
-
93
-
94
-
95
-
96
-
97
-
98
-
99
-
100
-
101
-
102
-
103
-
104
-
105
-
106
-
107
-
108
-
109
-
110
-
111
-
112
-
113
-
114
-
115
-
116
-
117
-
118
-
119
-
120
-
121
-
122
-
123
-
124
-
125
-
126
-
127
-
128
-
129
-
130
-
131
-
132
-
133
-
134
-
135
-
136
-
137
-
138
-
139
-
140
-
141
-
142
-
143
-
144
-
145
-
146
-
147
-
148
-
149
-
150
-
151
-
152
-
153
-
154
-
155
-
156
 |
 |

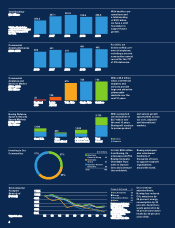
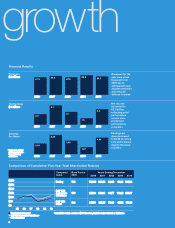
Commercial
Airplane Deliveries
2006– 2010
2006 2007 2008 2009 2010
398 441
375
481 462
For 2010, we
delivered 462 com-
mercial airplanes,
including a second
consecutive annual
record for the 737
of 376 deliveries.
Boeing Defense,
Space & Security
Served Markets
2010–2019
$ in billions
Core U.S.
1,600
Core
International
800
Adjacent U.S.
& International
1,300
Total
Served
3,700 With a projected
served market of
$3.7 trillion over
the next 10 years,
Boeing will continue
to pursue product
Services
Products
and service growth
opportunities across
our core, adjacent
and international
markets.
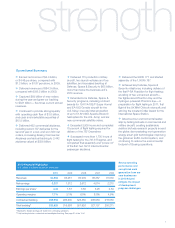
Total Backlog*
$ in billions
250.2
327.1 351.9 315.6 320.8
2006 2007 2008 2009 2010
With healthy core
operations and
a total backlog
of $321 billion,
we have a solid
foundation to
support future
growth.
*Total backlog includes
contractual and unobligated
backlog. See page 21 of
the 10-K.
35
135
675 735 735
Regional
Jets
Large
Aircraft
Twin Aisle Single Aisle Services
Commercial
Airplanes and
Services Market
2010– 2019
$ in billions
With a $2.3 trillion
value, commercial
airplanes and
services provide
large and attractive
addressable
markets over the
next 10 years.
Investing in Our
Communities
In total, $160 million
from Boeing, its
employees and The
Boeing Company
Charitable Trust
went to improve
lives and communi-
ties worldwide.
Boeing employees
also volunteered
hundreds of
thousands of hours
to support nonprofit
organizations
around the world.
Employee
Financial Giving 43
Charitable
Grants 57
Business-Related
Donations 60
Total 160
$ in millions
27%
36%
37%
On a revenue-
adjusted basis,
Boeing has reduced
CO2 emissions by
28 percent, energy
consumption by 30
percent, hazardous-
waste generation by
44 percent and water
intake by 42 percent
since 2002.
Environmental
Footprint
Reduction*
(Percent)
*Major U.S. sites
Performance indicators
normalized to revenue.
CO2 Emissions:
metric ton/$ million
Energy: MMBtu/$ million
Hazardous Waste:
ton/$ million
Water: gallons/$ million
CO2 Emissions 28
Energy 30
Hazardous Waste 44
Water 42
Progress Achieved %
040302 05 06 07 08 09 10
70%
60%
50%
80%
90%
100%
110%
4
71525bo_1_8 4 3/7/11 11:42 PM