Boeing 2010 Annual Report Download - page 3
Download and view the complete annual report
Please find page 3 of the 2010 Boeing annual report below. You can navigate through the pages in the report by either clicking on the pages listed below, or by using the keyword search tool below to find specific information within the annual report.-
 1
1 -
 2
2 -
 3
3 -
 4
4 -
 5
5 -
 6
6 -
 7
7 -
 8
8 -
 9
9 -
 10
10 -
 11
11 -
 12
12 -
 13
13 -
 14
14 -
15
-
16
-
17
-
18
-
19
-
20
-
21
-
22
-
23
-
24
-
25
-
26
-
27
-
28
-
29
-
30
-
31
-
32
-
33
-
34
-
35
-
36
-
37
-
38
-
39
-
40
-
41
-
42
-
43
-
44
-
45
-
46
-
47
-
48
-
49
-
50
-
51
-
52
-
53
-
54
-
55
-
56
-
57
-
58
-
59
-
60
-
61
-
62
-
63
-
64
-
65
-
66
-
67
-
68
-
69
-
70
-
71
-
72
-
73
-
74
-
75
-
76
-
77
-
78
-
79
-
80
-
81
-
82
-
83
-
84
-
85
-
86
-
87
-
88
-
89
-
90
-
91
-
92
-
93
-
94
-
95
-
96
-
97
-
98
-
99
-
100
-
101
-
102
-
103
-
104
-
105
-
106
-
107
-
108
-
109
-
110
-
111
-
112
-
113
-
114
-
115
-
116
-
117
-
118
-
119
-
120
-
121
-
122
-
123
-
124
-
125
-
126
-
127
-
128
-
129
-
130
-
131
-
132
-
133
-
134
-
135
-
136
-
137
-
138
-
139
-
140
-
141
-
142
-
143
-
144
-
145
-
146
-
147
-
148
-
149
-
150
-
151
-
152
-
153
-
154
-
155
-
156
 |
 |

1
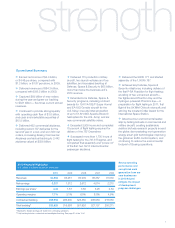
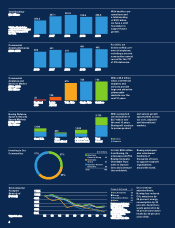
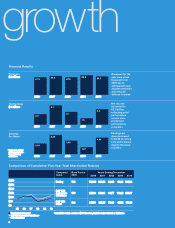
2010 2009 2008 2007 2006
Revenues 64,306 68,281 60,909 66,387 61,530
Net earnings 3,307 1,312 2,672 4,074 2,215
Earnings per share* 4.46 1.87 3.65 5.26 2.84
Operating margins 7.7% 3.1% 6.5% 8.8% 4.9%
Contractual backlog 303,955 296,500 323,860 296,964 216,563
Total backlog† 320,826 315,558 351,926 327,137 250,211
2010 Financial Highlights
U.S. dollars in millions except per share data
* Represents diluted earnings per share from continuing operations.
†Total backlog includes contractual and unobligated backlog. See page 21 of the 10-K.
QEarned net income of $3.3 billion,
or $4.46 per share, compared with
$1.3 billion, or $1.87 per share, in 2009.
QDelivered revenues of $64.3 billion,
compared with $68.3 billion in 2009.
QCaptured $69 billion of new orders
during the year and grew our backlog
to $321 billion—five times current annual
revenues.
QContinued to provide strong liquidity
with operating cash flow of $3.0 billion,
and cash and marketable securities of
$10.5 billion.
QDelivered 462 commercial airplanes,
including record 737 deliveries for the
second year in a row, and won 530 net
orders, increasing Boeing Commercial
Airplanes contractual backlog to 3,443
airplanes valued at $256 billion.
QDelivered 115 production military
aircraft, two launch vehicles and four
satellites, and increased backlog at
Defense, Space & Security to $65 billion,
more than twice the business unit’s
2010 revenue.
QExtended core Defense, Space &
Security programs, including contract
awards for 124 F/A-18E/F Super Hornet
and EA-18G Growler aircraft for the
U.S. Navy; low-rate initial production
of up to 51 AH-64D Apache Block III
helicopters for the U.S. Army; and six
new commercial satellite orders.
QExceeded 2,500 hours and completed
75 percent of flight testing required for
delivery of the 787 Dreamliner.
QSurpassed more than 1,700 hours of
flight testing for the 747-8 Freighter, and
completed final assembly and “power on”
of the first two 747-8 Intercontinental
passenger airplanes.
QDelivered the 900th 777 and started
assembly of the 1,000th 767.
QAchieved key Defense, Space &
Security milestones, including delivery of
the first P-8A Poseidon for flight testing;
unveiling of two unmanned aircraft—
the fighter-sized Phantom Ray and the
hydrogen-powered Phantom Eye—in
preparation for flight testing in 2011; first
flight of the UK Mk4 Chinook rotorcraft; and
winning the coveted Collier Award for the
International Space Station.
QAdvanced our environmental leader-
ship by testing biofuels on commercial and
military aircraft; creating sustainable
aviation biofuels research projects around
the globe; demonstrating next-generation
energy smart grid technologies; improving
the global air traffic control system; and
continuing to reduce the environmental
footprint of Boeing operations.
Operational Summary
Strong operating
performance and
exceptional cash
generation from our
core businesses
in 2010 helped
mitigate the impact
of development
program challenges.
strength
h