Boeing 2010 Annual Report Download - page 10
Download and view the complete annual report
Please find page 10 of the 2010 Boeing annual report below. You can navigate through the pages in the report by either clicking on the pages listed below, or by using the keyword search tool below to find specific information within the annual report.-
 1
1 -
 2
2 -
 3
3 -
 4
4 -
 5
5 -
 6
6 -
 7
7 -
 8
8 -
 9
9 -
 10
10 -
 11
11 -
 12
12 -
 13
13 -
 14
14 -
 15
15 -
 16
16 -
 17
17 -
 18
18 -
 19
19 -
 20
20 -
 21
21 -
22
-
23
-
24
-
25
-
26
-
27
-
28
-
29
-
30
-
31
-
32
-
33
-
34
-
35
-
36
-
37
-
38
-
39
-
40
-
41
-
42
-
43
-
44
-
45
-
46
-
47
-
48
-
49
-
50
-
51
-
52
-
53
-
54
-
55
-
56
-
57
-
58
-
59
-
60
-
61
-
62
-
63
-
64
-
65
-
66
-
67
-
68
-
69
-
70
-
71
-
72
-
73
-
74
-
75
-
76
-
77
-
78
-
79
-
80
-
81
-
82
-
83
-
84
-
85
-
86
-
87
-
88
-
89
-
90
-
91
-
92
-
93
-
94
-
95
-
96
-
97
-
98
-
99
-
100
-
101
-
102
-
103
-
104
-
105
-
106
-
107
-
108
-
109
-
110
-
111
-
112
-
113
-
114
-
115
-
116
-
117
-
118
-
119
-
120
-
121
-
122
-
123
-
124
-
125
-
126
-
127
-
128
-
129
-
130
-
131
-
132
-
133
-
134
-
135
-
136
-
137
-
138
-
139
-
140
-
141
-
142
-
143
-
144
-
145
-
146
-
147
-
148
-
149
-
150
-
151
-
152
-
153
-
154
-
155
-
156
 |
 |

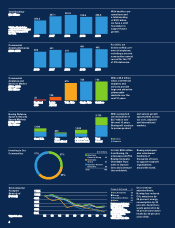
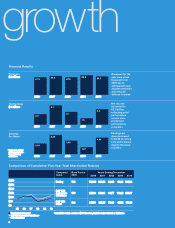
Revenues
$ in billions
Net Earnings
$ in billions
61.5 66.4 60.9 68.3 64.3
2006 2007 2008 2009 2010
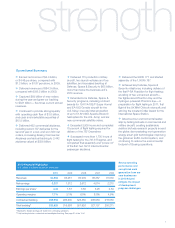
Revenues for the
year were down
6 percent from
2009 due to
anticipated lower
airplane deliveries
and reduced
defense volumes.
2006 2007 2008 2009 2010
2.2
4.1
2.7
1.3
3.3
Net income
increased to
$3.3 billion,
reflecting solid
performance
across core
production
and services
programs.
Earnings
Per Share*
2006
*Represents diluted
earnings per share
from continuing
operations. 2007 2008 2009 2010
2.84
5.26
3.65
1.87
4.46
Earnings per
share increased
to $4.46 on strong
core performance
despite the lower
volumes.
$0
$300
$150
$250
$200
$50
$100
The Boeing Company
S&P 500 Aerospace & Defense
S&P 500 Index
*Cumulative return assumes $100 invested, includes reinvestment of dividends
Boeing
S&P 500
Index
S&P 500
Aerospace
& Defense
0605 07 08 09 10
Comparison of Cumulative* Five-Year Total Shareholder Returns
Company/
Index Years Ending December
Base Period
2005
100
100
100
2006
128.38
125.16
115.79
2007
128.24
149.34
122.15
2008
64.08
94.77
76.95
2009
84.41
118.12
97.32
2010
104.32
135.97
111.98
Financial Results
8
growth
growth
71525bo_1_8 8 3/7/11 11:42 PM