Barnes and Noble 2010 Annual Report Download - page 8
Download and view the complete annual report
Please find page 8 of the 2010 Barnes and Noble annual report below. You can navigate through the pages in the report by either clicking on the pages listed below, or by using the keyword search tool below to find specific information within the annual report.-
 1
1 -
 2
2 -
 3
3 -
 4
4 -
 5
5 -
 6
6 -
 7
7 -
 8
8 -
 9
9 -
 10
10 -
 11
11 -
 12
12 -
 13
13 -
 14
14 -
 15
15 -
 16
16 -
 17
17 -
 18
18 -
 19
19 -
20
-
21
-
22
-
23
-
24
-
25
-
26
-
27
-
28
-
29
-
30
-
31
-
32
-
33
-
34
-
35
-
36
-
37
-
38
-
39
-
40
-
41
-
42
-
43
-
44
-
45
-
46
-
47
-
48
-
49
-
50
-
51
-
52
-
53
-
54
-
55
-
56
-
57
-
58
-
59
-
60
-
61
-
62
-
63
-
64
-
65
-
66
-
67
-
68
-
69
-
70
-
71
-
72
-
73
-
74
-
75
-
76
 |
 |

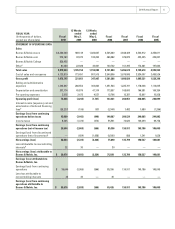
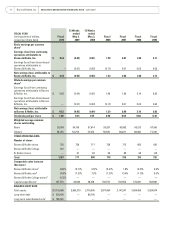
FISCAL YEAR
(In thousands of dollars,
except per share data)
Fiscal
2010
13 Weeks
ended
May 2,
2009
13 Weeks
ended
May 3,
2008
Fiscal
2008
Fiscal
2007
Fiscal
2006
Fiscal
2005
Basic earnings per common
sharee
Earnings (loss) from continuing
operations attributable to
Barnes & Noble, Inc. $ 0.64 (0.04) (0.01) 1.50 2.07 2.24 2.11
Earnings (loss) from discontinued
operations attributable to
Barnes & Noble, Inc. — (0.01) (0.03) (0.17) 0.01 0.02 0.02
Net earnings (loss) attributable to
Barnes & Noble, Inc. $ 0.64 (0.05) (0.04) 1.33 2.08 2.26 2.14
Diluted earnings per common
sharee
Earnings (loss) from continuing
operations attributable to Barnes
& Noble, Inc. $ 0.63 (0.04) (0.01) 1.46 1.99 2.14 2.00
Earnings (loss) from discontinued
operations attributable to Barnes
& Noble, Inc. — (0.01) (0.03) (0.17) 0.01 0.02 0.02
Net earnings (loss) attributable
to Barnes & Noble, Inc. $ 0.63 (0.05) (0.04) 1.29 2.00 2.16 2.02
Dividends paid per share $ 1.00 0.25 0.15 0.90 0.60 0.60 0.30
Weighted average common
shares outstanding
Basic 55,344 54,759 57,614 55,207 63,662 65,212 67,560
Diluted 56,153 54,759 57,614 56,529 66,221 68,388 71,336
OTHER OPERATING DATA
Number of stores
Barnes & Noble stores 720 726 717 726 713 695 681
Barnes & Noble College 637——— —— —
B. Dalton stores — 51 83 52 85 98 118
Total 1,357 777 800 778 798 793 799
Comparable sales increase
(decrease)
Barnes & Noble storesf(4.8)% (5.7)% (1.5)% (5.4)% 1.8% (0.3)% 2.9%
Barnes & Noble.comg24.0% (7.2)% 7.2% (1.3)% 13.4% (1.1)% 5.0%
Barnes & Noble College storesh(0.3)% — — — — — —
Capital expendituresi127,779 22,822 38,278 192,153 193,958 176,040 182,698
BALANCE SHEET DATA
Total assets $ 3,705,686 2,664,279 2,779,006 2,877,864 3,141,247 3,084,456 3,024,674
Long-term debt $ 260,400 — 86,700 — — — —
Long-term subordinated notej$ 150,000 ——— —— —
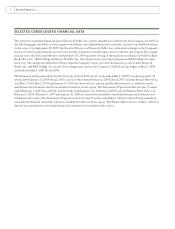
6 Barnes & Noble, Inc. SELECTED CONSOLIDATED FINANCIAL DATA continued