Barnes and Noble 2010 Annual Report Download - page 14
Download and view the complete annual report
Please find page 14 of the 2010 Barnes and Noble annual report below. You can navigate through the pages in the report by either clicking on the pages listed below, or by using the keyword search tool below to find specific information within the annual report.-
 1
1 -
2
-
3
-
 4
4 -
 5
5 -
 6
6 -
 7
7 -
 8
8 -
 9
9 -
 10
10 -
 11
11 -
 12
12 -
 13
13 -
 14
14 -
 15
15 -
 16
16 -
 17
17 -
 18
18 -
 19
19 -
 20
20 -
 21
21 -
 22
22 -
 23
23 -
 24
24 -
25
-
26
-
27
-
28
-
29
-
30
-
31
-
32
-
33
-
34
-
35
-
36
-
37
-
38
-
39
-
40
-
41
-
42
-
43
-
44
-
45
-
46
-
47
-
48
-
49
-
50
-
51
-
52
-
53
-
54
-
55
-
56
-
57
-
58
-
59
-
60
-
61
-
62
-
63
-
64
-
65
-
66
-
67
-
68
-
69
-
70
-
71
-
72
-
73
-
74
-
75
-
76
 |
 |

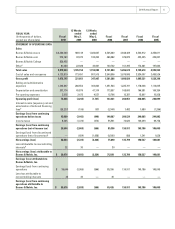
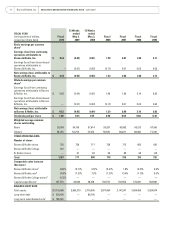
RESULTS OF OPERATIONS
13 Weeks Ended
Fiscal Year Fiscal 2010 May 2, 2009 May 3, 2008 Fiscal 2008 Fiscal 2007
Sales (in thousands) $ 5,810,564 1,105,152 1,155,882 5,121,804 5,286,674
Earnings (Loss) From Continuing Operations Attributable
to Barnes & Noble, Inc. (in thousands) $ 36,676 (2,039) (566) 85,426 134,911
Diluted Earnings (Loss) Per Common Share From
Continuing Operations $ 0.63 (0.04) (0.01) 1.46 1.99
Comparable Sales Increase (Decrease)
Barnes & Noble storesa (4.8)% (5.7)% (1.5)% (5.4)% 1.8%
Barnes & Noble.comb 24.0% (7.2)% 7.2% (1.3)% 13.4%
Barnes & Noble College storesc(0.3)% — — — —
STORES OPENED
Barnes & Noble stores 8 6 11 35 31
Barnes & Noble Colleged 11 — — — —
B. Dalton stores — — — — —
Total 19 6 11 35 31
STORES CLOSED
Barnes & Noble stores 18 6 7 22 13
Barnes & Noble Colleged6——— —
B. Dalton stores 47 1 2 33 13
Total 71 7 9 55 26
NUMBER OF STORES OPEN AT YEAR END
Barnes & Noble storese720 726 717 726 713
Barnes & Noble College 637——— —
B. Dalton stores — 51 83 52 85
Total 1,357 777 800 778 798
SQUARE FEET OF SELLING SPACE AT YEAR END (in millions)
Barnes & Noble storese18.7 18.8 18.3 18.7 18.2
B. Dalton stores — 0.2 0.3 0.2 0.3
Total 18.7 18.9 18.6 18.9 18.5
a Comparable store sales increase (decrease) is calculated on a 52-week basis (with the exception of those presented for the 13 weeks ended May 2,
2009 and May 3, 2008), and includes sales of stores that have been open at least 15 months and does not include closed or relocated stores.
b Comparable online sales increase (decrease) is calculated by adjusting the prior year results to conform with the fiscal 2010 presentation.
c Comparable store sales increase (decrease) is calculated since Acquisition and includes sales from stores that have been open for at least 15 months
and does not include closed or relocated stores.
d Represents the number of B&N College stores opened and closed since the Acquisition date.
e Includes the four B. Dalton stores converted to B&N Bookseller stores at February 1, 2010.
12 Barnes & Noble, Inc. MANAGEMENT’S DISCUSSION AND ANALYSIS OF FINANCIAL CONDITION AND RESULTS OF OPERATIONS continued