Bank of Montreal 2012 Annual Report Download - page 9
Download and view the complete annual report
Please find page 9 of the 2012 Bank of Montreal annual report below. You can navigate through the pages in the report by either clicking on the pages listed below, or by using the keyword search tool below to find specific information within the annual report.-
 1
1 -
 2
2 -
 3
3 -
 4
4 -
 5
5 -
 6
6 -
 7
7 -
 8
8 -
 9
9 -
 10
10 -
 11
11 -
 12
12 -
 13
13 -
 14
14 -
 15
15 -
 16
16 -
 17
17 -
 18
18 -
 19
19 -
 20
20 -
21
-
22
-
23
-
24
-
25
-
26
-
27
-
28
-
29
-
30
-
31
-
32
-
33
-
34
-
35
-
36
-
37
-
38
-
39
-
40
-
41
-
42
-
43
-
44
-
45
-
46
-
47
-
48
-
49
-
50
-
51
-
52
-
53
-
54
-
55
-
56
-
57
-
58
-
59
-
60
-
61
-
62
-
63
-
64
-
65
-
66
-
67
-
68
-
69
-
70
-
71
-
72
-
73
-
74
-
75
-
76
-
77
-
78
-
79
-
80
-
81
-
82
-
83
-
84
-
85
-
86
-
87
-
88
-
89
-
90
-
91
-
92
-
93
-
94
-
95
-
96
-
97
-
98
-
99
-
100
-
101
-
102
-
103
-
104
-
105
-
106
-
107
-
108
-
109
-
110
-
111
-
112
-
113
-
114
-
115
-
116
-
117
-
118
-
119
-
120
-
121
-
122
-
123
-
124
-
125
-
126
-
127
-
128
-
129
-
130
-
131
-
132
-
133
-
134
-
135
-
136
-
137
-
138
-
139
-
140
-
141
-
142
-
143
-
144
-
145
-
146
-
147
-
148
-
149
-
150
-
151
-
152
-
153
-
154
-
155
-
156
-
157
-
158
-
159
-
160
-
161
-
162
-
163
-
164
-
165
-
166
-
167
-
168
-
169
-
170
-
171
-
172
-
173
-
174
-
175
-
176
-
177
-
178
-
179
-
180
-
181
-
182
-
183
-
184
-
185
-
186
-
187
-
188
-
189
-
190
-
191
-
192
-
193
 |
 |

6 BMO Financial Group 195th Annual Report 2012
Canada
70%
U.S.
26%
Other
4%
Canada
85%
U.S.
10%
Other
5%
It is here that our bank will find sustainable growth
and where we’ll make our contribution, in terms of higher
shareholder returns and greater economic prosperity.
We’ve now refocused our collective efforts on growing
BMO’s customer base, and to that end we’re aggressively
pursuing the new opportunities opening up every day in
our redefined home market.
Record results driven by sound strategy1
BMO’s strong consolidated operating results for 2012 reflect
the collective actions of 46,000 employees to meet the
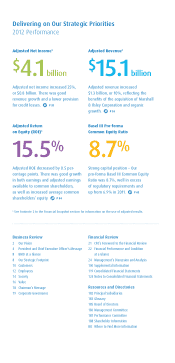
high expectations of all our stakeholders. Adjusted net
income grew to a record $4.1 billion – an increase of 25%
over 2011. Total adjusted revenue rose by 10% to an all-
time high of $15.1 billion, with an adjusted return on equity
of 15.5%. Adjusted earnings per share grew by 18% – well
above our target range of 8% to 10% – and we maintained
strong capital ratios exceeding regulatory requirements.
Confidence in the long-term value of all four BMO
businesses has advanced. We increased the dividend in
2012 while in the same period, our pro-forma Basel III
common equity ratio was not simply rebuilt but stood
above 8.7%, greater than prior to the expansion of our
U.S. footprint. We have flexibility in deploying capital
going forward.
Within our larger North American footprint, Personal
and Commercial Banking earned nearly $2.4 billion in
adjusted net income in 2012. The Canadian contribution
of nearly $1.8 billion was up 3% on an actual loss basis
from the previous year, while the U.S. component, at
US$579 million, reflected a gain of 48%.
The Private Client Group achieved good growth in
2012. Adjusted net income increased 12% to $546 million,
including a contribution of more than $100 million from
the U.S. We made several strategic acquisitions during the
year to extend our global presence and enhance our
wealth offering for both Asset Management and Private
Banking customers.
BMO Capital Markets delivered annual adjusted
net income of $949 million, with a strong return on equity
of 20.2%. Corporate and Institutional banking is now
allocated about 20% of the bank’s total capital. It is sized
to contribute as a stable, well-diversified business.
Setting clear priorities for the future
The bank’s strategic priorities are a clear statement of
intent through which we turn our strategy into action and
by which we then measure our success. And while they’re
discussed in detail elsewhere in this report, they merit
comment here.
Adjusted net income1 increased by 25%
2012
2011
PRESIDENT AND CHIEF EXECUTIVE OFFICER’S MESSAGE
$4.1 billion$3.3 billion
1 Adjusted results are non-GAAP and are discussed in the Non-GAAP Measures section on page 98. Reported results are shown on the inside cover
and in Management’s Discussion and Analysis.