Bank of Montreal 2012 Annual Report Download - page 2
Download and view the complete annual report
Please find page 2 of the 2012 Bank of Montreal annual report below. You can navigate through the pages in the report by either clicking on the pages listed below, or by using the keyword search tool below to find specific information within the annual report.-
 1
1 -
 2
2 -
 3
3 -
 4
4 -
 5
5 -
 6
6 -
 7
7 -
 8
8 -
 9
9 -
 10
10 -
 11
11 -
 12
12 -
 13
13 -
14
-
15
-
16
-
17
-
18
-
19
-
20
-
21
-
22
-
23
-
24
-
25
-
26
-
27
-
28
-
29
-
30
-
31
-
32
-
33
-
34
-
35
-
36
-
37
-
38
-
39
-
40
-
41
-
42
-
43
-
44
-
45
-
46
-
47
-
48
-
49
-
50
-
51
-
52
-
53
-
54
-
55
-
56
-
57
-
58
-
59
-
60
-
61
-
62
-
63
-
64
-
65
-
66
-
67
-
68
-
69
-
70
-
71
-
72
-
73
-
74
-
75
-
76
-
77
-
78
-
79
-
80
-
81
-
82
-
83
-
84
-
85
-
86
-
87
-
88
-
89
-
90
-
91
-
92
-
93
-
94
-
95
-
96
-
97
-
98
-
99
-
100
-
101
-
102
-
103
-
104
-
105
-
106
-
107
-
108
-
109
-
110
-
111
-
112
-
113
-
114
-
115
-
116
-
117
-
118
-
119
-
120
-
121
-
122
-
123
-
124
-
125
-
126
-
127
-
128
-
129
-
130
-
131
-
132
-
133
-
134
-
135
-
136
-
137
-
138
-
139
-
140
-
141
-
142
-
143
-
144
-
145
-
146
-
147
-
148
-
149
-
150
-
151
-
152
-
153
-
154
-
155
-
156
-
157
-
158
-
159
-
160
-
161
-
162
-
163
-
164
-
165
-
166
-
167
-
168
-
169
-
170
-
171
-
172
-
173
-
174
-
175
-
176
-
177
-
178
-
179
-
180
-
181
-
182
-
183
-
184
-
185
-
186
-
187
-
188
-
189
-
190
-
191
-
192
-
193
 |
 |

Bank of Montreal uses a unified branding approach that links the organization’s member companies under the
brand “BMO Financial Group”. Information about the intercorporate relationships among Bank of Montreal and
its principal subsidiaries is provided on page 182 of the 2012 financial statements, which page is incorporated
herein by reference. These subsidiaries are incorporated under the laws of the state, province or country in
which their head or principal office is located with the exception of: BMO Harris Financial Advisors, Inc., BMO
(US) Lending, LLC, BMO Global Capital Solutions, Inc., BMO Capital Markets Corp., BMO Harris Financing, Inc.,
BMO Financial Corp., BMO Asset Management Corp., psps Holdings, LLC, and BMO Capital Markets GKST Inc.,
each of which is incorporated in Delaware.
Financial Snapshot
Reported1 Adjusted1,2
As at or for the year ended October 31
(Canadian $ in millions, except as noted) 2012 2011 2012 2011
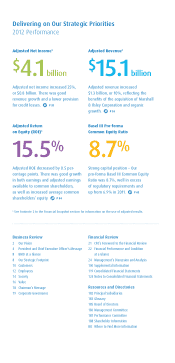
Revenue (p 36) 16,130 13,943 15,067 13,742
Provision for credit losses (p 40) 765 1,212 471 1,108
Non-interest expense (p 42) 10,238 8,741 9,513 8,453
Net income (p 32) 4,189 3,114 4,092 3,275
Earnings per share – diluted ($) (p 32) 6.15 4.84 6.00 5.10
Return on equity (p 34) 15.9% 15.1% 15.5% 16.0%
Basel II Common Equity Ratio (p 61) 10.5% 9.6% 10.5% 9.6%
Basel III Common Equity Ratio
–pro-forma (p 62) 8.7% 6.9% 8.7% 6.9%
Net Income by Segment
Personal & Commercial Canada (p 46) 1,784 1,773 1,794 1,781
Personal & Commercial U.S. (p 49) 517 352 581 387
Private Client Group (p 52) 525 476 546 486
BMO Capital Markets (p 55) 948 902 949 902
Corporate Services (p 58)3 415 (389) 222 (281)
Net income (p 32) 4,189 3,114 4,092 3,275
1
As of November 1, 2011, BMO’s financial results have been reported in accordance with International Financial
Reporting Standards (IFRS). Results for fiscal 2011 have been restated accordingly. Certain other prior-year
data has also been reclassified to conform with the current year’s presentation. See pages 43 and 44.
2 Adjusted results are non-GAAP and are discussed in the Non-GAAP Measures section on page 98.
Management assesses performance on a GAAP basis and on an adjusted basis and considers both to be
useful in the assessment of underlying business performance. Presenting results on both bases provides
readers with an enhanced understanding of how management assesses results.
3 Corporate Services, including Technology and Operations.