Bank of Montreal 2012 Annual Report Download
Download and view the complete annual report
Please find the complete 2012 Bank of Montreal annual report below. You can navigate through the pages in the report by either clicking on the pages listed below, or by using the keyword search tool below to find specific information within the annual report.-
 1
1 -
 2
2 -
 3
3 -
 4
4 -
 5
5 -
 6
6 -
 7
7 -
 8
8 -
 9
9 -
 10
10 -
 11
11 -
 12
12 -
13
-
14
-
15
-
16
-
17
-
18
-
19
-
20
-
21
-
22
-
23
-
24
-
25
-
26
-
27
-
28
-
29
-
30
-
31
-
32
-
33
-
34
-
35
-
36
-
37
-
38
-
39
-
40
-
41
-
42
-
43
-
44
-
45
-
46
-
47
-
48
-
49
-
50
-
51
-
52
-
53
-
54
-
55
-
56
-
57
-
58
-
59
-
60
-
61
-
62
-
63
-
64
-
65
-
66
-
67
-
68
-
69
-
70
-
71
-
72
-
73
-
74
-
75
-
76
-
77
-
78
-
79
-
80
-
81
-
82
-
83
-
84
-
85
-
86
-
87
-
88
-
89
-
90
-
91
-
92
-
93
-
94
-
95
-
96
-
97
-
98
-
99
-
100
-
101
-
102
-
103
-
104
-
105
-
106
-
107
-
108
-
109
-
110
-
111
-
112
-
113
-
114
-
115
-
116
-
117
-
118
-
119
-
120
-
121
-
122
-
123
-
124
-
125
-
126
-
127
-
128
-
129
-
130
-
131
-
132
-
133
-
134
-
135
-
136
-
137
-
138
-
139
-
140
-
141
-
142
-
143
-
144
-
145
-
146
-
147
-
148
-
149
-
150
-
151
-
152
-
153
-
154
-
155
-
156
-
157
-
158
-
159
-
160
-
161
-
162
-
163
-
164
-
165
-
166
-
167
-
168
-
169
-
170
-
171
-
172
-
173
-
174
-
175
-
176
-
177
-
178
-
179
-
180
-
181
-
182
-
183
-
184
-
185
-
186
-
187
-
188
-
189
-
190
-
191
-
192
-
193
 |
 |

BMO FINANCIAL GROUP 195TH ANNUAL REPORT 2012
Table of contents
-
Page 1
BMO FINANCIAL GROUP 195TH ANNUAL REPORT 2012 -
Page 2
.... Bank of Montreal uses a unified branding approach that links the organization's member companies under the brand "BMO Financial Group". Information about the intercorporate relationships among Bank of Montreal and its principal subsidiaries is provided on page 182 of the 2012 financial statements... -
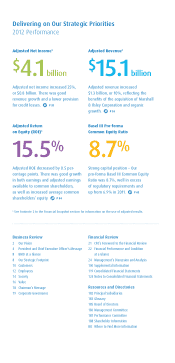
Page 3
... lower provision P 32 for credit losses. $15.1 billion Adjusted revenue increased $1.3 billion, or 10%, reflecting the benefits of the acquisition of Marshall & Ilsley Corporation and organic P 36 growth. Adjusted Return on Equity (ROE)1 Basel III Pro-forma Common Equity Ratio 15.5% Adjusted ROE... -
Page 4
... financial futures. P 10 Employees are empowered to make banking simpler for everyone. P 12 Society expects banks to act responsibly in connecting people with opportunities. P 14 Banks build value for shareholders by helping customers succeed. P 16 BMO Financial Group 195th Annual Report 2012... -
Page 5
A clear vision: To be the bank that defines great customer experience. Strategic priorities 1 2 BMO Financial Group 195th Annual Report 2012 Achieve industryleading customer loyalty by delivering on our brand promise. 2 Enhance productivity to drive performance and shareholder value. -
Page 6
3 Leverage our consolidated North American platform to deliver quality earnings growth. 4 Expand strategically in select global markets to create future growth. 5 Ensure our strength in risk management underpins everything we do for our customers. BMO Financial Group 195th Annual Report 2012 3 -
Page 7
... our brand represents the bank's clear commitment to what we believe matters to people. And it's about what's important to the many millions of individual shareholders who own our shares - outright or through mutual funds and retirement accounts - and to those who manage investments on their behalf... -
Page 8
... North American platform allows us to grow our customer base on a more competitive scale. BMO is now the second-largest Canadian bank measured by number of retail branches in Canada and the U.S. The bank has the earnings momentum and scale to translate balance-sheet growth into market-share gains... -
Page 9
..., Personal and Commercial Banking earned nearly $2.4 billion in adjusted net income in 2012. The Canadian contribution of nearly $1.8 billion was up 3% on an actual loss basis from the previous year, while the U.S. component, at US$579 million, reflected a gain of 48%. The Private Client Group... -
Page 10
... the benefit of our customers as for our shareholders. Similarly, decisions about where and when to invest are centred around the creation of value. In 2012 we introduced a series of initiatives across the bank aimed at finding more efficient ways to deliver superior service to our customers. These... -
Page 11
...and investment banking products through our operating groups: Personal and Commercial Banking; Private Client Group; and BMO Capital Markets. Delhi Mumbai Our Beijing Shanghai Guangzhou Hong Kong Asia-Pacific Trading Corridor Two years of growth Measure 2010 1 20121 Increase (decrease) % Increase... -
Page 12
...City St. Louis Phoenix Indianapolis Milwaukee Toronto Ottawa Fredericton Saskatoon St. John's Charlottetown Halifax San Francisco New York Los Angeles Core Retail Footprint* Southern Market Presence Houston Sarasota West Palm Beach Fort Lauderdale BMO Financial Group 195th Annual Report 2012 9 -
Page 13
...and pursue research and development," says Tom Nieman, Fromm's president. "People were skeptical, but I don't think I ever doubted we could do it. You just need a bank that shares your values. BMO Harris Bank has helped us achieve our goals and grow." 10 BMO Financial Group 195th Annual Report 2012 -
Page 14
... twice by the Ipsos Best Banking Awards in Canada, which honours financial institutions with topranked personal banking customer service. BMO was recognized in two categories: Financial Planning and Advice, and Value For Money. 10 2010 12 2012 BMO Financial Group 195th Annual Report 2012 11 -
Page 15
.... And it's about reducing layers between decision-makers and customers so that problems get solved and needs get addressed more quickly and effectively. This is the key to building customer loyalty and shareholder value: make banking simpler. 12 BMO Financial Group 195th Annual Report 2012 The -
Page 16
...of success: 96 % 25% less customer wait time of BMO employees believe they are contributing to our vision to be the bank that defines great customer experience. 50% less branch processing 30% improvement in quality 25% overall productivity gain BMO Financial Group 195th Annual Report 2012 13 -
Page 17
... system brings many benefits, along with the obligation to help keep the system healthy and stable. Only by managing their businesses responsibly, with a prudent approach to risk, can banks live up to the trust that society has placed in them. The 14 BMO Financial Group 195th Annual Report 2012 -
Page 18
... $ BMO's Open For Business campaign will make up to $10 billion in financing available to Canadian businesses over three years. 10 billion Enhancing knowledge of risk Rotation programs that place talented risk professionals in each of our business groups strengthen risk management - a long-time... -
Page 19
... products and services and inspire the endless fine-tuning of every business process and personal interaction. To create lasting value is to build deeper relationships with existing customers while working to attract new ones. In other words, the people who engage with a bank - whether in the branch... -
Page 20
... Banker Team of the Year Americas for 2012 by Global M&A Network. And for the second consecutive year, Global Banking & Finance Review named BMO Harris Private Banking the Best Private Bank in Canada. adviceDirect In 2012, BMO InvestorLine launched adviceDirect for online investors. The new service... -
Page 21
... Financial Group for 20 years - the maximum permitted term under our term limits - most recently as a member of the Audit and Conduct Review and Risk Review committees. Hal, one of the most respected business leaders in Canada's energy industry, has recently returned to a full-time chief executive... -
Page 22
... and strong corporate governance over short-term financial performance. Our core values guide that strategic direction and oversight, as well as the board's relationship with management and accountability to shareholders. Our governance practices promote ethical business conduct FirstPrinciples... -
Page 23
... and exchange of ideas with shareholders As set out in our Shareholder Engagement Policy, we communicate with shareholders in a variety of ways including our annual shareholder meeting, the annual report, management proxy circular, quarterly reports, annual information form, news releases, website... -
Page 24
... basis, net income rose to $4.1 billion, increasing 25% from last year with significantly improved results from Personal and Commercial Banking and Private Client Group, solid net income growth from BMO Capital Markets and improved Corporate Services results. We also increased the dividend this year... -
Page 25
... The North American peer group average annual three-year 2011 2012 2010 TSR was 7.3%, well below the Canadian average, reflecting negative returns for our U.S. peer banks in 2011. The one-year TSR in 2012 was 39.2%. Earnings per Share (EPS) Growth P 32 • Adjusted net income grew $817 million... -
Page 26
...peer group, except National Bank of Canada, as well as BB&T Corporation, Bank of New York Mellon, Fifth Third Bancorp, Key Corp., The PNC Financial Services Group Inc., Regions Financial, SunTrust Banks Inc. and U.S. Bancorp. Results are as at or for the years ended October 31 for Canadian banks and... -
Page 27
... in Accounting Policies in 2012 Future Changes in Accounting Policies Disclosure Controls and Procedures and Internal Control over Financial Reporting Shareholders' Auditors' Services and Fees Enterprise-Wide Risk Management outlines our approach to managing the key financial risks and other related... -
Page 28
... customers across Canada through our Canadian retail arm, BMO Bank of Montreal. We also serve customers through our wealth management businesses: BMO Nesbitt Burns, BMO InvestorLine, BMO Private Banking, BMO Global Asset Management and BMO Insurance. BMO Capital Markets, our investment and corporate... -
Page 29
...BMO InvestorLine launched in Canada adviceDirect, an innovative and personal service that provides investing advice to online investors, a first in Canada. o Introduced BMO Harris Mobile Banking in the United States, allowing retail and small business customers to use their mobile phones for account... -
Page 30
... limited to: general economic and market conditions in the countries in which we operate; weak, volatile or illiquid capital and/or credit markets; interest rate and currency value fluctuations; changes in monetary, fiscal or economic policy; the degree of competition in the geographic and business... -
Page 31
... an increase in credit losses, a decrease in loan growth and reduced capital markets activity. In addition, the financial services industry is characterized by interrelations among financial services companies. As a result, defaults by other financial services companies in Canada, the United States... -
Page 32
... working order. Some of our services (such as online banking) or operations may face the risk of interruption or other security risks due to the nature of the risks related to the use of the internet in these services or operations, which may impact our customers and infrastructure. Given the high... -
Page 33
... of the year, before slowing in response to more restrictive mortgage rules. Business investment stayed strong, with support from robust resource prices and low interest rates, resulting in a pickup in the growth of short-term loans and non-residential mortgages. Personal deposit growth strengthened... -
Page 34
... S&P/TSX BMO Index Composite Financial common Index Services shares Index All returns represent total returns. BMO's three-year average annual return was strong. BMO's TSR was above the overall market return in Canada in 2012. Total Shareholder Return For the year ended October 31 2012 2011 2010... -
Page 35
... loan portfolio 251 M&I integration costs (250) M&I acquisition-related costs - Hedge of foreign exchange risk on the purchase of M&I - Amortization of acquisition-related intangible assets (96) Decrease (increase) in the collective allowance for credit losses 53 Run-off structured credit activities... -
Page 36
... rate in 2012. Personal and Commercial Banking (P&C) and Private Client Group (PCG) results in 2012 were up significantly from 2011, while BMO Capital Markets (BMO CM) experienced solid net income growth and Corporate Services results improved considerably as it recorded net income compared to a net... -
Page 37
... online, branch, core banking and mobile banking platforms. We now expect annual cost savings from the integration of the acquired business and BMO of at least US$400 million, up from the previous estimate of US$300 million a year ago. More than two-thirds of the synergies were achieved by the end... -
Page 38
... growth in Private Client Group, excluding Insurance, due to acquisitions and growth across most businesses, as well as in Insurance operations. BMO Capital Markets revenues decreased slightly, reflecting a more challenging market environment for our Investment Banking businesses. Corporate Services... -
Page 39
...LGM results in 2012. Revenue in Private Client Group, excluding Insurance, increased 12%, as a result of acquisitions, earnings from a strategic investment and growth in revenues across most businesses. Assets under management and administration improved by $40 billion to $465 billion, due to market... -
Page 40
...For the year ended October 31 2012 2011 $ % Average earning assets ($ millions) Change 2012 2011 $ % Net interest margin (in basis points) 2012 2011 Change P&C Canada P&C U.S. Personal and Commercial Banking (P&C) Private Client Group (PCG) BMO Capital Markets (BMO CM) Corporate Services, including... -
Page 41
... Revenue ($ millions) For the year ended October 31 2012 2011 2010 Change from 2011 $ % Securities commissions and fees Deposit and payment service charges Trading revenues Lending fees Card fees Investment management and custodial fees Mutual fund revenues Securitization revenues Underwriting and... -
Page 42
... gains (losses) from both on-balance sheet instruments and interest rate, foreign exchange (including spot positions), equity, commodity and credit contracts. Interest and Non-Interest Trading-Related Revenues (1) ($ millions) (taxable equivalent basis) For the year ended October 31 2012 2011 2010... -
Page 43
...year ended October 31 Provision for credit losses 2012 2011 2010 Actual Expected Actual Expected Actual Expected losses losses losses losses losses losses P&C Canada 593 251 P&C U.S. (1) Purchased credit impaired loans (236) Personal and Commercial Banking 608 PCG 19 BMO Capital Markets - Corporate... -
Page 44
...at the time of acquisition. On a geographic basis, the United States accounted for the majority of impaired loan formations, comprising 70.3% of total formations in 2012, compared with 49.9% in 2011, with the increase related to the M&I purchased performing loan portfolio. The commercial real estate... -
Page 45
... ratio in Private Client Group increased by 30 basis points to 75.5%, as top-line revenue growth was offset by an increase in spending on strategic priorities. BMO Capital Markets efficiency ratio of 59.8% deteriorated by 240 basis points primarily due to increases in employee-related costs... -
Page 46
...preferred customers. We also offer employees a subsidy on annual credit card fees. Stock options and deferred share units granted to directors, and preferred rate loan agreements for executives relating to transfers we initiate, are discussed in Note 27 on page 168 of the financial statements. 2012... -
Page 47
...way they report the financial results related to retail mutual fund sales. Prior periods have been restated. During 2011, approximately US$1.0 billion of impaired real estate secured assets, comprised primarily of commercial real estate loans, were transferred to Corporate Services from P&C U.S. to... -
Page 48
Personal and Commercial Banking (Canadian $ in millions, except as noted) P&C Canada Change from 2011 $ % P&C U.S. Change from 2011 $ % P&C Change from 2011 $ % As at or for the year ended October 31 2012 2011* 2010 2012 2011* 2010 2012 2011* 2010 Net interest income (teb) Non-interest ... -
Page 49
... - personal banking and commercial banking. These include solutions for everyday banking, financing, investing, credit cards and creditor insurance, as well as a variety of commercial products and financial advisory services. We deliver services through our network of BMO Bank of Montreal branches... -
Page 50
... our Personal Banking customers. ‰ Target regional opportunities in Commercial Banking to grow our market share in lending and deposits. ‰ Implement core process redesign and new technologies to improve productivity and the customer experience. BMO Financial Group 195th Annual Report 2012 47 -
Page 51
...net of strong expense management. Our efficiency ratio deteriorated by 70 basis points to 51.7%. Improving productivity and the customer experience is an objective for P&C Canada in 2013. In this regard, a number of initiatives are underway such as eStatements, mobile banking enhancements and online... -
Page 52
....1 71 Our Lines of Business Personal Banking offers a broad range of products and services to individuals, as well as small and mid-sized business customers, including deposits, mortgages, consumer credit, business lending, credit cards and other banking services. Commercial Banking provides larger... -
Page 53
...-over-quarter growth. Year-over-year growth was 15%, and deposits remained at high levels. ‰ Broadened our commercial capabilities by creating a franchise finance specialty and opening new offices to drive growth in dealership finance, equipment finance, food & consumer, and corporate banking... -
Page 54
.... The remaining increase of $56 million or 3.9% on an organic basis was primarily due to growth in both gains on the sale of newly originated mortgages and commercial lending fees. Net interest margin decreased by 9 basis points due to deposit spread compression in a low rate environment as well... -
Page 55
...to online investors. BMO's private banking businesses operate in Canada and the United States and plan to expand into Hong Kong and Singapore. Offering a comprehensive range of financial services and solutions, we deliver a planning and advice-based value proposition to high net worth and ultra-high... -
Page 56
... to online investors, a first in Canada. ‰ Our family of BMO exchange traded funds (ETFs) provides our clients with lower-cost diversified investment products and had the highest Net Promoter Score among all fund families in Canada for 2011 and 2012. ‰ Launched a new financial planning website... -
Page 57
... economic growth in the United States was also modest, its stock markets recorded double-digit gains, led by a sharp rebound in share values in the financial sector. Reductions in long-term interest rates had a negative impact on our insurance results as lower rates resulted in an increase in... -
Page 58
... sales, trading and research activities. We offer integrated debt, foreign exchange, interest rate, credit, equity, securitization and commodities solutions to institutional, commercial and retail clients. In addition, we provide new product development, proprietary trading and origination services... -
Page 59
... market share in Canada. ‰ Leverage our U.S. investments to drive better operating performance. ‰ Continue to support our North American platform internationally. ‰ Improve financial performance by growing net income with a focus on managing costs. 56 BMO Financial Group 195th Annual Report... -
Page 60
...Our Trade Finance business continues to benefit from the dislocation in the global credit environment and delivered a strong performance in 2012. Notwithstanding an increase in its capital, the business earned an ROE of more than 20%. Looking forward, we expect modest growth in Canada and the United... -
Page 61
... (T&O) manages, maintains and provides governance over information technology, operations services, real estate and sourcing for BMO Financial Group. The costs of Corporate Units and T&O services are largely transferred to the three client operating groups (P&C, PCG and BMO Capital Markets), with... -
Page 62
...Loans and Acceptances ($ millions) As at October 31 2012 2011 2010 2009 2008 Deposits increased $21.3 billion to $323.7 billion. The increase was largely driven by a $26.0 billion increase in deposits by businesses and governments, which grew in both the United States and Canada. Deposits by banks... -
Page 63
... discussion of the risks that underlie our business activities, refer to the Enterprise-Wide Risk Management section on page 75. 60 BMO Financial Group 195th Annual Report 2012 BMO primarily uses the Advanced Internal Ratings Based (AIRB) Approach to determine credit risk-weighted assets (RWA... -
Page 64
..., 2012, up from $20.0 billion and $25.1 billion, respectively, at October 31, 2011. Adjusted common equity increased due to retained earnings growth and the issuance of common shares through the Shareholder Dividend Reinvestment and Share Purchase Plan and the exercise of stock options. This growth... -
Page 65
... shareholders' equity, which may be required on a national basis by supervisors if they perceive credit growth resulting in systemic risk. If imposed, this additional buffer is effectively combined with the Capital Conservation buffer. (2) Does not include any applicable increases for banks that... -
Page 66
...49 Note 20 on page 156 of the financial statements includes details on share capital. Total Economic Capital by Operating Group As at October 31, 2012 P&C Canada 24% Business 4% Operational 12% Market 12% Credit 72% Corporate Services, including T&O 2% BMO CM 25% PCG 8% P&C U.S. 41% Credit risk... -
Page 67
... position. We have no Canadian home equity line of credit exposures that had a loan-to-value ratio in excess of 80% at origination. The portfolio is of high quality and only a low percentage of loans in the portfolio were 90 days or more in arrears at year end. In Canada, we do not have a mortgage... -
Page 68
...loan did not meet the terms and conditions of the purchase and sale agreement at the time of sale. BMO Harris Bank repurchased a total of 138 mortgages in 2012 (76 in 2011) totalling US$22.6 million (US$11.3 million in 2011). We do not anticipate material losses from any related future mortgage loan... -
Page 69
... BMO structured investment vehicle (SIV), Links Finance Corporation (Links). We consolidate the SIV under IFRS and our exposure to potential losses in the SIV relates to the loan facility that was put in place in order to fund the repayment of its senior notes. In the second quarter of 2012... -
Page 70
... tradeable cash products, while exposure related to banks was comprised of trading instruments, short-term debt, derivative positions and letters of credit and guarantees. In addition to the exposures shown in the table, we have exposure to European supranational institutions totalling $0.49 billion... -
Page 71
... loans and trade finance. Amounts are net of write-offs and gross of specific allowances, both of which are not considered material. (2) Securities includes cash products, insurance investments and traded credit. Gross traded credit includes only the long positions and excludes off-setting short... -
Page 72
...new requirements relating to risk-based capital, leverage limits, liquidity standards, risk-management frameworks, concentration and credit exposure limits, resolution planning and credit exposure reporting. If implemented in its current form, the Proposed Rule would apply to BMO's U.S. bank holding... -
Page 73
... capital and funding trusts, except for certain Canadian customer securitization and structured finance vehicles. MD&A Guarantees Guarantees include contracts under which we may be required to make payments to a counterparty based on changes in the value of an asset, liability or equity security... -
Page 74
...cash flows. Additional information regarding our accounting for pension and other employee future benefits, including a sensitivity analysis for key assumptions, is included in Note 23 on page 160 of the financial statements. MD&A Financial Instruments Measured at Fair Value BMO records securities... -
Page 75
... less costs to sell was used to perform the impairment test in 2012 and 2011. In determining fair value less costs to sell, we employ a discounted cash flow model, consistent with that used when we acquire businesses. This model is dependent on assumptions related to revenue growth, discount rates... -
Page 76
... with Canadian GAAP as defined at that time. Changes in accounting policies that are a result of conforming to IFRS are described more fully in Note 30 on page 177 of the financial statements. Future Changes in Accounting Policies Employee Benefits The International Accounting Standards Board (IASB... -
Page 77
... BMO's internal control over financial reporting. Shareholders' Auditors' Services and Fees Pre-Approval Policies and Procedures As part of BMO Financial Group's corporate governance practices, the Board of Directors oversees the strict application of BMO's corporate policy limiting the services... -
Page 78
... Rajpal Executive Vice-President and Chief Risk Officer BMO Financial Group ‰ ‰ ‰ Strengths and Value Drivers ‰ Unified and strong risk culture that is embedded across the enterprise. ‰ Risk appetite that shapes business strategies and is integrated into our decision-making processes... -
Page 79
... transferring talented risk professionals to our business groups. Maximize the value of our impaired loans and effectively manage problem accounts. ‰ Successfully migrated and integrated the M&I loan portfolio onto our risk platform and systems. ‰ Reduced exposure to certain stressed real estate... -
Page 80
... Reputation Risk Management Chief Executive Officer Operational Risk Operating Groups First Line of Defence Enterprise Risk and Portfolio Management Corporate Support Areas Corporate Audit Group Third Line of Defence Second Line of Defence BMO Financial Group 195th Annual Report 2012 77 -
Page 81
... of integrity, governance, internal controls, succession planning and evaluation of senior management, communication, public disclosure and corporate governance. Risk Review Committee of the Board of Directors (RRC) assists the board in fulfilling its oversight responsibilities in relation to BMO... -
Page 82
... risk types, given our guiding principles and capital capacity, thereby supporting sound business initiatives and growth. Our risk appetite is integrated into both our strategic planning processes and our lines of business. On an annual basis, senior management recommends our Risk Appetite Statement... -
Page 83
... sale of treasury and other capital markets products, the holding of investment securities and securitization activities. BMO's robust credit risk management framework is aligned with the three-lines-of-defence approach to managing risk. As the first line of defence, operating groups are accountable... -
Page 84
...process, the redistribution of exposures, and the purchase or sale of insurance through guarantees or credit default swaps. Total enterprise-wide outstanding credit exposures were $496 billion at October 31, 2012, comprised of $308 billion in Canada, $157 billion in the United States and $31 billion... -
Page 85
... place to ensure adherence to delegated market risk limits. Amounts exceeding established limits are communicated to senior management on a timely basis for resolution and appropriate action. Material in blue-tinted font above is an integral part of the 2012 annual consolidated financial statements... -
Page 86
...financial statements. Our models are used to determine market risk Economic Capital for each of our lines of business and to determine regulatory capital. For capital calculation purposes, longer holding periods and/or higher confidence levels are used than are employed in day-to-day risk management... -
Page 87
... 30 Nov 31 Dec 31 Jan 29 Feb 31 Mar 30 Apr 31 May 30 Jun 31 Jul 31 Aug 30 Sep 31 Oct Interest rate VaR (mark-to-market) Foreign exchange VaR Issuer risk Commodity VaR Equity VaR Interest rate VaR (AFS) 84 BMO Financial Group 195th Annual Report 2012 -
Page 88
... year reflects the growth in the insurance business, lower interest rates and changes in investment mix. Models used to measure structural market risk project changes in interest and foreign exchange rates and predict how customers would likely react to the changes. For customer loans and deposits... -
Page 89
... Medium-Term Note Programs, Canadian and U.S. mortgage securitizations, Canadian credit card securitizations, covered bonds and Canadian and U.S. senior (unsecured) deposits. During 2012, BMO issued $15.8 billion of wholesale term funding in Canada and internationally. Total wholesale term funding... -
Page 90
...programs with central banks or other market sources. BMO's cash and securities as a percentage of total assets was 29.4% at October 31, 2012, compared with 29.5% at October 31, 2011. Customer Deposits-andCapital-to-Total-Loans Ratio (%) 106.6 104.1 MD&A BMO uses the Net Liquidity Position (NLP) as... -
Page 91
... to funding and capital through capital markets could be reduced. A material downgrade of our ratings could have additional consequences, including those set out in Note 10 on page 140 of the financial statements. On October 26, 2012, Moody's Investors Service placed the senior long-term debt rating... -
Page 92
... to senior management and the board on a regular basis. BMO is a member of the Operational Riskdata eXchange Association, an international association of banks that share loss data information anonymously to assist in risk identification, assessment and modelling. Capital Quantification BMO uses The... -
Page 93
... the day-to-day management of their legal and regulatory risk in accordance with enterprise-wide policies. LCCG provides advice and independent risk management oversight through legal and compliance teams with designated operating group and corporate area responsibility. LCCG also works closely with... -
Page 94
... management process. BMO's Office of Strategic Management (OSM) oversees our strategic planning processes and works with the lines of business, along with risk, finance and other corporate areas, to identify, monitor and mitigate strategic risk across the enterprise. A rigorous strategic management... -
Page 95
... related to BMO or its customers. Environmental and social risk is often associated with credit, operational and reputation risk. Environmental and social risk is addressed in our board-approved corporate responsibility and sustainability policy. Environmental and social risk management activities... -
Page 96
... net interest margin. There was good revenue growth in commercial banking and personal banking, with revenues growing by 7.8% and 3.6%, respectively. Non-interest expense increased $169 million or 5.6% to $3,148 million due to higher initiative-related spending, higher employee-related costs and... -
Page 97
... costs, in line with improved performance. Net income in BMO Capital Markets increased $86 million to $902 million in 2011, as revenue increases and lower provisions for credit losses were partially offset by increased expenses. Revenue increased $21 million to $3,299 million in 2011. Revenue growth... -
Page 98
...losses on the M&I purchased credit impaired loan portfolio and lower provisions charged to Corporate Services under BMO's expected loss provisioning methodology. BMO's revenue increased $250 million or 6.8% to $3,920 million. There was strong growth in BMO Capital Markets and in Private Client Group... -
Page 99
... increases in the average number of product categories used by both personal and commercial banking customers. We have strengthened our branch network, expanded our ABM network and added to our specialized sales force. P&C Canada has maintained its good performance over the past two years. Results... -
Page 100
... Commercial Banking Private Client Group BMO Capital Markets Corporate Services, including T&O BMO Financial Group reported net income Adjusted net income Information per Common Share ($) Dividends declared Earnings Basic Diluted Adjusted earnings Basic Diluted Book value Market price High Low Close... -
Page 101
...tax); Private Client Group $6 million ($6 million after tax); and BMO Capital Markets $1 million ($1 million after tax). In the fourth quarter of 2012, adjusting items decreased net income by $88 million ($43 million after tax) and included a $35 million net benefit after tax of credit-related items... -
Page 102
... expense growth (%) Efficiency ratio (%) Operating leverage (%) Return on equity (%) Adjusting Items (Pre-tax) Credit-related items on the M&I purchased performing loan portfolio (2) M&I integration costs (4) M&I acquisition-related costs Hedge costs related to foreign exchange risk on purchase of... -
Page 103
...2012 2011 2010 2009 2008 2007 2006 2005 2004 2003 Market Price per Common Share ($) High Low Close Common Share Dividends Dividends declared per share ($) Dividends paid per share ($) Dividend payout ratio (%) Dividend yield (%) Dividends declared ($ millions) Total Shareholder Return (%) Five-year... -
Page 104
... 2: Summary Income Statement and Growth Statistics For the year ended October 31 2012 2011 2010 ($ millions, except as noted) 5-year CAGR 10-year CAGR 2009 2008 Income Statement - Reported Results Net interest income Non-interest revenue Total revenue Provision for credit losses Non-interest... -
Page 105
... 31 ($ millions) 2012 2011 2010 2009 2008 Assets Cash and cash equivalents Interest bearing deposits with banks Securities Securities borrowed or purchased under resale agreements Net loans and acceptances Other assets Total assets Liabilities and Shareholders' Equity Deposits Other liabilities... -
Page 106
...as noted) 2012 2011 2010 2009 2008 Canadian Dollar Cash and Securities Cash and cash equivalents Interest bearing deposits with banks Securities (1) Government debt Mortgage-backed securities and collateralized mortgage obligations (2) Corporate debt Corporate equity Total securities Total Canadian... -
Page 107
...Other Information Employees (1) Canada United States Other Total Bank branches Canada United States Other Total Automated banking machines Canada United States Total Rates Average Canadian prime rate (%) Average U.S. prime rate (%) Canadian/U.S. dollar exchange rates ($) High Low Average End of year... -
Page 108
...Revenue Ratio For the year ended October 31 2012 2011 2010 2009 ($ millions, except as noted) 5-year CAGR 10-year CAGR 2008 Non-Interest Expense Employee compensation Salaries Performance-based compensation Employee benefits Total employee compensation Premises and equipment Rental of real estate... -
Page 109
...assets Total Canadian dollar U.S. Dollar and Other Currencies Deposits with other banks Securities Securities borrowed or purchased under resale agreements Loans Residential mortgages Non-residential mortgages Consumer instalment and other personal Credit cards Businesses and governments Total loans... -
Page 110
...in Canadian dollar interest income U.S. Dollar and Other Currencies Deposits with other banks Securities Securities borrowed or purchased under resale agreements Loans Residential mortgages Non-residential mortgages Consumer instalment and other personal Credit cards Businesses and governments Total... -
Page 111
... noted) Canada As at October 31 2012 2011 2010 2009 2008 2012 United States 2011 2010 2009 2008 2012 Other countries 2011 2010 2009 2008 Supplemental Information Consumer Residential mortgages Consumer instalment and other personal loans Total consumer Commercial and corporate Total impaired loans... -
Page 112
... in Canada Net Commercial and Corporate Loans by Industry Commercial mortgages (6) Commercial real estate Construction (non-real estate) Retail trade Wholesale trade Agriculture Communications Manufacturing Mining Oil and gas Transportation Utilities Forest products Service industries Financial... -
Page 113
... Credit Losses - Segmented Information ($ millions, except as noted) Canada As at October 31 2012 2011 2010 2009 2008 2012 United States 2011 2010 2009 2008 2012 Other countries 2011 2010 2009 2008 Consumer Residential mortgages Consumer instalment and other personal loans Total consumer Commercial... -
Page 114
... (non-real estate) Retail trade Wholesale trade Agriculture Communications Manufacturing Mining Oil and gas Transportation Utilities Forest products Service industries Financial institutions Government Other Total specific allowances for credit losses on commercial and corporate loans (6) 53... -
Page 115
... loans and trade finance. Amounts are net of write-offs and gross of specific allowances, both of which are not considered material. (3) Securities include cash products, insurance investments and traded credit. Gross traded credit includes only the long positions and excludes offsetting short... -
Page 116
... to issue Air Miles in Canada to our customers. In 2000, we entered into a 15-year contract with an external service provider for cheque processing, statement production, mail distribution, ABM envelope processing and wholesale lockbox processing. BMO Financial Group 195th Annual Report 2012 113 -
Page 117
...-sale equity securities Securitization-related deductions Expected loss in excess of allowance (AIRB Approach) (2) Substantial investments and investments in insurance subsidiaries (3) Other deductions Adjusted common shareholders' equity Non-cumulative preferred share (4) Innovative Tier 1 capital... -
Page 118
... cost Fair value (1) 2012 2011 2010 ($ millions) Unrealized gains (losses) (2) 2009 2008 Canadian governments debt U.S. governments debt Mortgage-backed securities - Canada Mortgage backed securities - United States Corporate debt Corporate equity Other governments debt Total available-for-sale... -
Page 119
... over financial reporting. Our system of internal controls includes written communication of our policies and procedures governing corporate conduct and risk management; comprehensive business planning; effective segregation of duties; delegation of authority and personal accountability; escalation... -
Page 120
..., changes in equity and cash flows for the years ended October 31, 2012 and 2011, and notes, comprising a summary of significant accounting policies and other explanatory information. Management's Responsibility for the Consolidated Financial Statements Management is responsible for the preparation... -
Page 121
... of the Public Company Accounting Oversight Board (United States), the consolidated balance sheets of the bank as of October 31, 2012, October 31, 2011 and November 1, 2010, the consolidated statements of income, comprehensive income, changes in equity and cash flows for the years ended October 31... -
Page 122
... service charges Trading revenues Lending fees Card fees Investment management and custodial fees Mutual fund revenues Underwriting and advisory fees Securities gains, other than trading (Note 3) Foreign exchange, other than trading Insurance income Other Total Revenue Provision for Credit Losses... -
Page 123
... Income Attributable to: Bank shareholders Non-controlling interest in subsidiaries (Note 18) Total Comprehensive Income The accompanying notes are an integral part of these consolidated financial statements. Consolidated Financial Statements 120 BMO Financial Group 195th Annual Report 2012 -
Page 124
... other comprehensive income Total shareholders' equity Non-controlling interest in subsidiaries Total Equity Total Liabilities and Equity The accompanying notes are an integral part of these consolidated financial statements. 500,575 $ 437,710 BMO Financial Group 195th Annual Report 2012 121 -
Page 125
... of year Stock option expense/exercised (Note 22) Foreign exchange on redemption of preferred shares (Note 20) Balance at End of Year Retained Earnings Balance at beginning of year Net income attributable to Bank shareholders Dividends - Preferred shares (Note 20) - Common shares (Note 20) Share... -
Page 126
... Statement of Cash Flows For the Year Ended October 31 (Canadian $ in millions) 2012 2011 Cash Flows from Operating Activities Net income Adjustments to determine net cash flows provided by (used in) operating activities Impairment write-down of securities, other than trading (Note 3) Net... -
Page 127
... Statements Note 1: Basis of Presentation Bank of Montreal ("the bank"), is a public company incorporated in Canada having its registered office in Montreal, Canada. We are a highly diversified financial services provider and provide a broad range of retail banking, wealth management and investment... -
Page 128
...fees, cash advance fees and annual fees. Card fees are recorded as billed, except for annual fees, which are recorded evenly throughout the year. Purchased loans Significant judgment and assumptions were applied to determine the fair value of the Marshall & Ilsley Corporation ("M&I") loan portfolio... -
Page 129
... cash flows. Additional information regarding our accounting for pension and other employee future benefits is included in Note 23. Impairment We have investments in securities issued or guaranteed by Canadian, U.S. and other governments, corporate debt and equity securities, mortgage-backed... -
Page 130
... 1, 2015. We are currently assessing the impact of this new standard on our future financial results in conjunction with the completion of the other phases of the IASB's financial instruments project. Note 2: Cash Resources and Interest Bearing Deposits with Banks (Canadian $ in millions) 2012 2011... -
Page 131
...be sold in response to or in anticipation of changes in interest rates and resulting prepayment risk, changes in foreign currency risk, changes in funding sources or terms, or to meet liquidity needs. Available-for-sale securities are initially recorded at fair value plus transaction costs. They are... -
Page 132
... equities, term to maturity is assumed to be over 10 years unless specified otherwise. (2) These amounts are supported by insured mortgages. Yields in the table above are calculated using the cost of the security and the contractual interest or stated dividend rates associated with each security... -
Page 133
... by insured mortgages. Income from securities has been included in our consolidated financial statements as follows: (Canadian $ in millions) 2012 2011 Reported in Consolidated Statement of Income: Interest, Dividend and Fee Income (1) Trading securities (2) Available-for-sale securities Held... -
Page 134
... loan, we use the value of the estimated future cash flows discounted at the loan's original effective interest rate. The determination of estimated future cash flows of a collateralized loan reflects the expected realization of the underlying security net of expected costs and any amounts legally... -
Page 135
...: Notes (Canadian $ in millions) For the year ended October 31 Residential mortgages 2012 2011 Credit card, consumer instalment and other personal loans 2012 2011 Business and government loans (2) 2012 2011 2012 Total 2011 By geographic region (1): Canada United States Other Countries Total... -
Page 136
...31, 2012 ($2,053 million in 2011). During the year ended October 31, 2012, we recorded a net gain of $4 million (net loss of $31 million in 2011) on the sale of impaired loans. Insured Mortgages Included in the residential mortgages balance are Canadian government and corporate insured mortgages of... -
Page 137
... 80 to 81 of this report. Additional information on loans and derivative-related credit risk is disclosed in Notes 4 and 10, respectively. Basel II Framework We use the Basel II Framework for our capital management framework. We use the Advanced Internal Ratings Based ("AIRB") approach to determine... -
Page 138
... font in the Enterprise-Wide Risk Management section of Management's Discussion and Analysis on page 80 of this report. Wholesale Credit Exposure by Risk Rating (Canadian $ in millions) Bank Drawn Corporate Sovereign Bank Undrawn (1) Corporate Sovereign 2012 Total exposure 2011 Total exposure Based... -
Page 139
... exchange rates, equity and commodity prices and their implied volatilities, and credit spreads, as well as the risk of credit migration and default. We incur market risk in our trading and underwriting activities and structural banking activities. Notes 136 BMO Financial Group 195th Annual Report... -
Page 140
...: (Canadian $ in millions) Less than 1 year 2012 2011 1 to 3 years 2012 2011 3 to 5 years 2012 2011 Over 5 years 2012 2011 No fixed maturity 2012 2011 Total 2012 2011 Off-Balance Sheet Financial Instruments Commitments to extend credit (1) Operating leases Financial guarantee contracts (1) Purchase... -
Page 141
... Balance Sheet as at October 31, 2012 and 2011 related to these indemnifications. Exchange and Clearinghouse Guarantees We are a member of several securities and futures exchanges and clearinghouses. Membership in certain of these organizations may require us to pay a pro rata share of the losses... -
Page 142
...-backed securities funding our bank securitization vehicles ($10,292 million in 2011). (3) Total assets include cash and interest bearing deposits of $2,069 million and securities of $157 million ($2,052 million and $167 million, respectively in 2011). BMO Financial Group 195th Annual Report 2012... -
Page 143
... exchange a series of cash flows. The various swap agreements that we enter into are as follows: Interest rate swaps - counterparties generally exchange fixed and floating rate interest payments based on a notional value in a single currency. Notes 140 BMO Financial Group 195th Annual Report 2012 -
Page 144
...main risks associated with these instruments are related to exposure to movements in interest rates, foreign exchange rates, credit quality, securities values or commodities prices, as applicable, and the possible inability of counterparties to meet the terms of the contracts. market risk positions... -
Page 145
... trading. There was no hedge ineffectiveness associated with net investment hedges for the year ended October 31, 2012 (no ineffectiveness in 2011). We use foreign currency deposits with a term to maturity of zero to three months as hedging instruments in net investment hedges, and the fair value... -
Page 146
... rate swaps Forward foreign exchange contracts Purchased options Written options Commodity Contracts Swaps Purchased options Written options Equity Contracts Credit Default Swaps Purchased Written Total fair value - trading derivatives Average fair value (1) Hedging Interest Rate Contracts Cash flow... -
Page 147
...to calculate the amount of cash that must be exchanged under the contract. Notional amounts do not represent assets or liabilities and therefore are not recorded in our Consolidated Balance Sheet. (Canadian $ in millions) Hedging Trading Cash flow Fair value Total Trading 2012 Hedging Cash flow Fair... -
Page 148
... Cross-currency interest rate swaps Forward foreign exchange contracts Purchased options Total foreign exchange contracts Commodity Contracts Swaps Purchased options Total commodity contracts Equity Contracts Credit Default Swaps Total derivatives Less: impact of master netting agreements Total 36... -
Page 149
... cost of contracts (before the impact of master netting agreements) with customers in the following industries: As at October 31, 2012 (Canadian $ in millions) Interest rate contracts Foreign exchange contracts Commodity contracts Equity contracts Credit default swaps Total Financial institutions... -
Page 150
... the value in use and the fair value less costs to sell. Value in use is the present value of the future cash flows expected to be derived from the asset. An impairment charge is recorded when the recoverable amount is less than the carrying value. Notes BMO Financial Group 195th Annual Report 2012... -
Page 151
... ended October 31, 2012, mainly related to adjustments in the valuation of the acquired loans. Goodwill related to this acquisition is not deductible for tax purposes. M&I is part of our Personal and Commercial Banking U.S., Private Client Group, BMO Capital Markets and Corporate Services reporting... -
Page 152
...goodwill by CGU for the years ended October 31, 2012 and 2011 is as follows: (Canadian $ in millions) P&C Canada P&C U.S. Personal and Commercial Banking Total Client Investing Investment Products Private Banking Insurance Private Client Group Total BMO Capital Markets Total Goodwill as at November... -
Page 153
... (Note 23) 7,813 861 526 630 508 10,338 6,248 870 637 724 411 8,890 3,875 857 443 1,077 399 6,651 Notes Total (1) Includes reinsurance assets related to our life insurance business in the amount of $472 million in 2012 ($497 million in 2011). 150 BMO Financial Group 195th Annual Report 2012 -
Page 154
... demand (Canadian $ in millions) Interest bearing 2012 2011 Non-interest bearing 2012 2011 Payable after notice 2012 2011 Payable on a fixed date 2012 2011 2012 Total 2011 November 1, 2010 Deposits by: Banks Businesses and governments Individuals Total (1) (2) Booked in: Canada United States Other... -
Page 155
... or loss and are accounted for at fair value, which better aligns the accounting result with the way the portfolio is managed. The change in fair value of these structured notes was an increase in non-interest revenue, trading revenues of $19 million for the year ended October 31, 2012 (decrease... -
Page 156
...our subordinated debt has a term to maturity of five years or more. Please refer to the offering circular related to each of the issues above for further details on Canada Yield Price calculations and definitions of Government of Canada Yield. Notes BMO Financial Group 195th Annual Report 2012 153 -
Page 157
... time, we are exposed to interest rate risk. of the business day and may change significantly in the subsequent periods based on customer behaviour and the application of our asset and liability management policies. The assumptions for the year ended October 31, 2012 were as follows: Interest Rate... -
Page 158
... interest rate gap position 2012 2011 November 1, 2010 U.S. Dollar and Other Currencies Assets Cash and cash equivalents Interest bearing deposits with banks Securities Securities borrowed or purchased under resale agreements Loans Other assets Total assets Liabilities and Equity Deposits Securities... -
Page 159
... our shareholders to issue an unlimited number of Class A Preferred shares and Class B Preferred shares without par value, in series, for unlimited consideration. Class B Preferred shares may be issued in a foreign currency. During the year ended October 31, 2012, we redeemed all of our U.S. dollar... -
Page 160
... shares. Shareholders also have the opportunity to make optional cash payments to acquire additional common shares. We may issue these common shares at an average of the closing price of our common shares on the Toronto Stock Exchange based on the five trading days prior to the last business day... -
Page 161
... capital ratio requirements as at October 31, 2012. Note 22: Employee Compensation - Stock-Based Compensation Stock Option Plan We maintain a Stock Option Plan for designated officers and employees. Options are granted at an exercise price equal to the closing price of our common shares on the day... -
Page 162
... options. To determine the fair value of the stock option tranches (i.e. the 25% portion that vests each year) on the grant date, the following ranges of values were used for each option pricing assumption: 2012 2011 Expected dividend yield Expected share price volatility Risk-free rate of return... -
Page 163
... members of our Board of Directors, executives and key employees in BMO Capital Markets and Private Client Group. Under these plans, fees, annual incentive payments and/or commissions can be deferred as stock units of our common shares. These stock units are fully vested on the grant date. The value... -
Page 164
... participants with benefit payments in the future. For pension benefit plans that are in a net benefit asset position, the recognized asset is limited to the total of any unrecognized actuarial losses and past service costs plus the present value of economic benefits available in the form of future... -
Page 165
... the year ended October 31, 2012 ($4 million in 2011) to us and certain of our subsidiaries for investment management, record-keeping, custodial and administrative services rendered on the same terms that we offer to our customers for these services. The plans did not hold any of our shares directly... -
Page 166
...that level thereafter Cash Flows Cash payments we made during the year in connection with our employee future benefit plans are as follows: (Canadian $ in millions) Pension benefit plans 2012 2011 Other employee future benefit plans 2012 2011 Contributions to defined benefit plans Contributions to... -
Page 167
... financial statements regardless of when they are recognized for income tax purposes, with the exception of repatriation of retained earnings from our foreign subsidiaries, as noted below. In addition, we record an income tax expense or benefit directly in shareholders' equity when the taxes relate... -
Page 168
...-for-sale securities, net of hedging activities Gains (losses) on cash flow hedges Hedging of unrealized gains (losses) on translation of net foreign operations Total Components of Total Provision for Income Taxes (Canadian $ in millions) (26) (48) (13) 851 2012 (40) 128 26 990 2011 Canada... -
Page 169
...84 Notes (1) In computing diluted earnings per share, we excluded average stock options outstanding of 6,226,858 and 4,549,499 with weighted-average exercise prices of $132.63 and $100.73 for the years ended October 31, 2012 and 2011, respectively. 166 BMO Financial Group 195th Annual Report 2012 -
Page 170
... the year ended October 31, 2011, approximately $1 billion of impaired real estate-secured loans, comprised primarily of commercial real estate loans were transferred to Corporate Services from P&C U.S. to allow our business to focus on ongoing customer relationships and leverage our risk management... -
Page 171
...personnel. (Canadian $ in millions) 2012 2011 Base salary and incentives Share-based payments (1) Total key management personnel compensation 14 23 37 16 25 41 Deferred Share Units Members of our Board of Directors are required to take 100% of their annual retainers and other fees in the form of... -
Page 172
...2012 and 2011, respectively. Members of the Board of Directors of our wholly owned subsidiary, BMO Financial Corp., are required to take a specified minimum amount of their annual retainers and other fees in the form of deferred share units. Joint Ventures and Associates We provide banking services... -
Page 173
..., default and recovery. Corporate Debt Securities The fair value of corporate debt securities is determined using the most recently executed transaction prices. When observable price quotations 170 BMO Financial Group 195th Annual Report 2012 Derivative Instruments A number of well established... -
Page 174
... terms linked to the performance of interest rates, foreign currencies, commodities or equity securities have been designated at fair value through profit or loss. The fair value of these structured notes is estimated using internally vetted valuation models and incorporates market observable prices... -
Page 175
... value over (under) book value Fair value Assets Cash and cash equivalents Interest bearing deposits with banks Securities Securities borrowed or purchased under resale agreements Loans Residential mortgages Consumer instalment and other personal Credit cards Businesses and governments Customers... -
Page 176
... mortgage obligations Corporate debt Corporate equity Other securities Fair Value Liabilities Securities sold but not yet purchased Structured note liabilities and other note liabilities Derivative Assets Interest rate contracts Foreign exchange contracts Commodity contracts Equity contracts Credit... -
Page 177
...prices. During the year ended October 31, 2011, derivative assets of $84 million and derivative liabilities of $13 million were transferred from Level 3 to Level 2 as market information became available for certain over-the-counter equity contracts. Notes 174 BMO Financial Group 195th Annual Report... -
Page 178
... Fair value as at October 31, 2012 For the year ended October 31, 2012 (Canadian $ in millions) Balance, October 31, 2011 Included in earnings Purchases Sales Transfers into Maturities (1) Level 3 Transfers out of Level 3 Unrealized gains (losses) (2) Trading Securities Issued or guaranteed... -
Page 179
...value as at October 31, 2011 For the year ended October 31, 2011 (Canadian $ in millions) Balance, November 1, 2010 Included in earnings Purchases Sales Transfers into Maturities (1) Level 3 Transfers out of Level 3 Unrealized gains (losses) (2) Trading Securities Mortgage-backed securities... -
Page 180
... these mortgages will remain on our balance sheet. ‰ Insurance contracts - IFRS 1 provides the option to apply the transitional provisions in IFRS 4, Insurance Contracts, which allow us to follow our existing accounting policies related to our insurance related activities, as described in Note 16... -
Page 181
... Cash and cash equivalents Interest bearing deposits with banks Securities Securities borrowed or purchased under resale agreements Loans Allowance for credit losses Other assets Total assets Liabilities Deposits Other liabilities Subordinated debt Capital trust securities Shareholders' Equity Share... -
Page 182
... Cash Flows from Financing Activities. Under IFRS, we classify the net changes in securities sold but not yet purchased as Cash Flows from Operating Activities, in accordance with IAS 7 Cash Flow Statements, which requires this classification for instruments used for trading purposes. Under Canadian... -
Page 183
... of net foreign operations to $nil at the transition date, with the adjustment recorded in opening retained earnings. This difference had no impact on our capital ratios or return on equity. (f) Reinsurance Under Canadian GAAP, reinsurance assets related to our life insurance business were... -
Page 184
...changes in fair value are recorded in income as they occur. Merchant banking investments that we have not designated at fair value through profit or loss are accounted for as either available-for-sale securities, investments accounted for using the equity method of accounting, or loans, depending on... -
Page 185
... Limited BMO InvestorLine Inc. BMO Service Inc. Bank of Montreal Ireland plc Bank of Montreal Mortgage Corporation BMO Mortgage Corp. BMRI Realty Investments Bay Street Holdings, LLC BMO Finance Company I BMO Financial Corp. BMO Asset Management Corp. and subsidiaries BMO Capital Markets Corp. BMO... -
Page 186
...contracts whose value is "derived" from movements in interest or foreign exchange rates, or equity or commodity prices. Derivatives allow for the transfer, modification or reduction of current or expected risks from changes in rates and prices. Dividend Payout Ratio represents common share dividends... -
Page 187
...), equity, commodity and credit contracts. P 39 Value at Risk (VaR) is measured for specific classes of risk in BMO's trading and underwriting activities: interest rate, foreign exchange rate, equity and commodity prices and their implied volatilities. This measure calculates the maximum loss likely... -
Page 188
... all committee meetings. We review membership of all committees annually. Robert M. Astley, Former President and Chief Executive Officer, Clarica Life Insurance Company, and former President, Sun Life Financial Canada Board/Committees: Governance and Nominating, Human Resources (Chair), Risk Review... -
Page 189
... New York and Chicago branches. Joined BMO in 1983; in role since April 2011 Patrick Cronin,1 Head, Trading Products, has global responsibility for all sales, trading and research activity for all asset classes and derivatives including equities, fixed income, foreign exchange and credit. Joined BMO... -
Page 190
..., BMO Capital Markets Darryl White Head, Global Investment and Corporate Banking Enterprise Risk and Portfolio Management Surjit Rajpal Executive Vice-President and Chief Risk Officer, BMO Financial Group Finance Thomas Flynn Executive Vice-President and Chief Financial Officer, BMO Financial Group... -
Page 191
... Company of Canada or Shareholder Services for details. Direct Deposit You can choose to have your dividends deposited directly to an account in any financial institution in Canada or the United States that provides electronic funds transfer. Personal Information Security We advise our shareholders... -
Page 192
... under New York Stock Exchange Listing Standards is posted on our website. www.bmo.com/corporategovernance Customers Online filing information: BMO filings in Canada Canadian Securities Administrators www.sedar.com For assistance with your investment portfolio or other financial needs: BMO Bank of... -
Page 193
BMO supports soccer from youth players in local communities all the way up to the professional level. For more information visit bmo.com/soccer This annual report is carbon neutral. Carbon offsets provided by: