Autodesk 2008 Annual Report Download - page 4
Download and view the complete annual report
Please find page 4 of the 2008 Autodesk annual report below. You can navigate through the pages in the report by either clicking on the pages listed below, or by using the keyword search tool below to find specific information within the annual report.-
 1
1 -
 2
2 -
 3
3 -
 4
4 -
 5
5 -
 6
6 -
 7
7 -
 8
8 -
 9
9 -
 10
10 -
 11
11 -
 12
12 -
 13
13 -
 14
14 -
 15
15 -
16
-
17
-
18
-
19
-
20
-
21
-
22
-
23
-
24
-
25
-
26
-
27
-
28
-
29
-
30
-
31
-
32
-
33
-
34
-
35
-
36
-
37
-
38
-
39
-
40
-
41
-
42
-
43
-
44
-
45
-
46
-
47
-
48
-
49
-
50
-
51
-
52
-
53
-
54
-
55
-
56
-
57
-
58
-
59
-
60
-
61
-
62
-
63
-
64
-
65
-
66
-
67
-
68
-
69
-
70
-
71
-
72
-
73
-
74
-
75
-
76
-
77
-
78
-
79
-
80
-
81
-
82
-
83
-
84
-
85
-
86
-
87
-
88
-
89
-
90
-
91
-
92
-
93
-
94
-
95
-
96
-
97
-
98
-
99
-
100
-
101
-
102
-
103
-
104
-
105
-
106
-
107
-
108
-
109
-
110
-
111
-
112
-
113
-
114
-
115
-
116
-
117
-
118
-
119
-
120
-
121
-
122
-
123
-
124
-
125
-
126
-
127
-
128
-
129
-
130
-
131
-
132
-
133
-
134
-
135
-
136
-
137
-
138
-
139
-
140
-
141
-
142
-
143
-
144
-
145
-
146
-
147
-
148
-
149
-
150
-
151
-
152
-
153
-
154
-
155
-
156
-
157
-
158
-
159
-
160
-
161
-
162
-
163
-
164
-
165
-
166
-
167
-
168
-
169
-
170
-
171
-
172
-
173
-
174
-
175
-
176
 |
 |
Today, Autodesk sells products in countries
around the world. While the majority of our
revenue is generated in developed countries,
another key growth driver for the company is
revenue generated in emerging economies, which
has been growing at roughly twice the pace of
revenue generated in developed countries. In
emerging economies, there is a high demand
for infrastructure as these countries prepare for
increased industrialization. Such infrastructure
includes airports, railways, roads, clean water,
and sanitation, to name just a few. In addition,
emerging economies are becoming major centers
for manufacturing of both consumer and industrial
products. In fiscal 2008, Autodesk revenue from
emerging economies increased 40 percent and
now represents 17 percent of total revenue.
Since 2004, our customers have migrated to
purchasing maintenance under our subscription
program. There are many benefits when customers
renew maintenance annually, such as freeing
channel partners to focus their efforts on new
customers. Increasing our maintenance base also
creates a more predictable revenue stream for
Autodesk, partially mitigating the risk of economic
uncertainty. Our maintenance base has grown
substantially over the past several years and now
consists of nearly 1.5 million users.
Other macro trends that continue to drive our
markets include the globalization of industry; the
building boom in which countries are building,
rebuilding, and repairing their infrastructure;
and global climate change, which requires
designers and engineers to make their products
and buildings more energy efficient and
environmentally friendly.
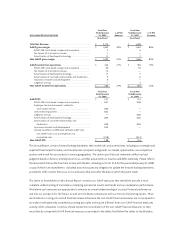
Record Financial Performance
Fiscal 2008 also marked the fifth straight year in
which we achieved record financial performance.
For the first time, Autodesk crossed the $2
billion revenue threshold. Net revenue increased
18 percent to $2.17 billion, and revenue from
new licenses increased 19 percent compared to
fiscal 2007.
Maintenance revenue increased 31 percent
compared to fiscal 2007, and was 25 percent of
total revenue in fiscal 2008.
While we have experienced very strong growth
in the 3D market, it’s important to recognize that
our core base of 2D solutions continues to post
healthy double-digit growth, led by outstanding
results for AutoCAD LT software. Strong growth
in 2D creates future opportunity as well, because
our 2D solutions provide the easiest migration
path to our 3D products and then to Digital
Prototyping.
While increasing revenue is always important,
increasing profitability and shareholder value is
equally important. In fiscal 2008 we increased our
GAAP diluted earnings per share by 24 percent to
$1.47, compared to $1.19 in fiscal 2007. Non-GAAP
diluted earnings per share increased 23 percent to
$1.88, compared to $1.53 in fiscal 2007.