Atmos Energy 2004 Annual Report Download - page 4
Download and view the complete annual report
Please find page 4 of the 2004 Atmos Energy annual report below. You can navigate through the pages in the report by either clicking on the pages listed below, or by using the keyword search tool below to find specific information within the annual report.-
 1
1 -
 2
2 -
 3
3 -
 4
4 -
 5
5 -
 6
6 -
 7
7 -
 8
8 -
 9
9 -
 10
10 -
 11
11 -
 12
12 -
 13
13 -
 14
14 -
 15
15 -
16
-
17
-
18
-
19
-
20
-
21
 |
 |

LETTER TO SHAREHOLDERS 3
DEAR FELLOW SHAREHOLDER:
Our 2004 fiscal year will stand as one of the biggest years
in Atmos Energy’s history. Not only did we do well
financially, we virtually doubled in size to become the
largest pure-gas utility in America. However, size is
only important if it is accompanied by performance, and
Atmos Energy performed exceptionally well in 2004.
Consolidated net income rose to $86.2 million, or
$1.58 per diluted share, compared with $71.7 million,
or $1.54 per diluted share, in 2003. Our total return to
shareholders was an enviable 10.4 percent, including
cash dividends of$1.22 paid during fiscal 2004. Return
on average shareholders’ equity was 9.1 percent.
Based on these strong results and our positive
forecast for 2005, the Board of Directors increased the
annual indicated dividend rate by 2 cents to $1.24 per
share. The increase marked our 17th consecutive annual
dividend increase. When adjusted for mergers and
acquisitions, Atmos Energy has paid higher dividends every
year since its founding in 1983. Fewer than 2.5 percent
of American corporations can match
our dividend history.
TXU GAS ACQUISITION
Our 2004 results were exceeded only
by the leap we made in our regulated
operations. On October 1, 2004, we
completed our acquisition of the
natural gas distribution and pipeline operations of TXU
Gas Company. This acquisition added 1.5 million utility
customers in one of the more dynamic American growth
markets. It also placed us in an excellent position to
benefit in the future for the following reasons:
Immediate contribution to 2005 earnings. We expect that
the operations of our new Mid-Tex Division will con-
tribute from 5 cents to 10 cents to earnings per share in
2005. We are forecasting our earnings per diluted share
in fiscal 2005 to be between $1.65 and $1.75.
Above-average residential and commercial growth. Our
new division serves rapidly growing communities in
the Dallas-Fort Worth Metroplex and northern suburbs
of Austin. The division’s net growth in customers
is approximately 2 percent a year, almost double our
former growth rate.
Added value from new gas pipeline operations. The
intrastate pipeline we acquired as part of the TXU Gas
operations runs from one end of Texas to the other.
It interconnects at three of the state’s major hubs, or gas
transfer points, with dozens of other
intrastate and interstate gas pipelines.
The 6,162-mile pipeline system delivers
gas to the 550 cities served by the
new division. Owning this asset gives us
expansion opportunities to transport
more natural gas for others besides our
own utility operations.
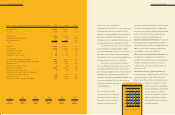
EARNINGS REVIEW
$1.80
1.50
1.20
0.90
0.60
0.30
0.00 2000 2001 2002 2003 2004
Earnings per diluted share
YEAR ENDED SEPTEMBER 30 (Dollars in thousands, except per share data) 2004 2003 Change
Operating revenues $ 2,920,037 $ 2,799,916 4.3%
Gross profit $ 562,191 $ 534,976 5.1%
Utility net income $63,096 $ 62,137 1.5%
Natural gas marketing net income (loss) 16,633 (970) 1814.7%
Other nonutility net income 6,498 10,521 -38.2%
Total $ 86,227 $ 71,688 20.3%
Total assets $2,869,883 $ 2,625,495 9.3%
Total capitalization $ 1,994,770 $ 1,720,017 16.0%
Net income per share – diluted $ 1.58 $ 1.54 2.6%
Cash dividends per share $1.22 $1.20 1.7%
Book value per share at end of year $ 18.05 $ 16.66 8.3%
Consolidated utility segment throughput (MMcf) 246,033 247,965 -0.8%
Consolidated natural gas marketing segment throughput (MMcf) 222,572 225,961 -1.5%
Heating degree days 3,271 3,473 -5.8%
Degree days as a percentage of normal 96% 101% -5.0%
Meters in service at end of year 1,679,136 1,672,798 0.4%
Return on average shareholders’ equity 9.1% 9.9% -8.1%
Shareholders’ equity as a percentage of total capitalization
(including short-term debt) at end of year 56.7% 46.4% 22.2%
Shareholders of record 27,555 28,510 -3.3%
Weighted average shares outstanding – diluted (000s) 54,416 46,496 17.0%
3
Letter to
Shareholders
18
Operations
Review
22
Financial
Review
30
Atmos Energy
Officers
31
Board of
Directors
32
Corporate
Information
2 FINANCIAL HIGHLIGHTS