Atmos Energy 2004 Annual Report Download - page 14
Download and view the complete annual report
Please find page 14 of the 2004 Atmos Energy annual report below. You can navigate through the pages in the report by either clicking on the pages listed below, or by using the keyword search tool below to find specific information within the annual report.-
 1
1 -
2
-
3
-
 4
4 -
 5
5 -
 6
6 -
 7
7 -
 8
8 -
 9
9 -
 10
10 -
 11
11 -
 12
12 -
 13
13 -
 14
14 -
 15
15 -
 16
16 -
 17
17 -
 18
18 -
 19
19 -
 20
20 -
 21
21
 |
 |

From rural to urban communities, Atmos
Energy spans the largest geographic area of any
natural gas utility in the country. Diversity in
economic conditions, weather patterns, regional
climates and regulatory conditions allows us to
accommodate extremes without significant risk.
The acquisition of TXU Gas gives Atmos Energy the
opportunity to serve 550 additional communities, including
two within the Top-10 largest gas markets in the U.S. as well
as several others equal to or larger than cities elsewhere
in our territory.The acquisition also
included a 6,162-mile intrastate
pipeline in Texas and hubs with
interstate lines to deliver gas to
cities like Chicago and New York.
Waha Hub
Katy Hub
Carthage
Hub
DALLAS
Mid-Tex Division
West Texas Division
Intrastate Pipeline
Corporate Headquarters
Major Gas Delivery Hub
Longview
Bryan
Waco
Round Rock
San Angelo
Abilene
Wichita Falls
Fort Worth
Denton
ALABAMA
ARKANSAS
COLORADO
GEORGIA
ILLINOIS
INDIANA
IOWA
KANSAS
KENTUCKY
LOUISIANA
MISSISSIPPI
MISSOURI
OHIO
OKLAHOMA
TENNESSEE
TEXAS
VIRGINIA
Atmos Energy Headquarters
States with Both Utility
and Nonutility Operations
States with Only
Nonutility Operations
Utility Service Areas
Atmos Energy Utility Division Offices
Atmos Energy Marketing Headquarters
Atmos Energy Marketing Regional Offices
DENVER
DALLAS
LUBBOCK
HOUSTON
JACKSON
BATON ROUGE
NEW ORLEANS
FRANKLIN
OWENSBORO
SOUTH
CAROLINA
Our acquisition of TXU Gas increased
our miles of pipeline by approximately
68 percent. Our Texas intrastate system
allows us to deliver more natural gas
to wholesale customers, thereby bringing
more revenue to our business.
ATMOS ENERGY ACQUIRED TERRITORY
47,616
miles
80,209
miles
remain abundant in North America, gas production has
not kept pace with the steady rise in demand.
During the 2004–2005 heating season, residential
heating bills will likely increase 10 percent to 15 percent
above bills of the previous heating season, according to the
federal Energy Information Administration. Tight sup-
plies also are causing greater volatility in natural gas prices.
To help protect our customers, we offer budget
billing plans, assistance for low-income customers and
information about lowering energy costs. We also
have advocated vigorously for federal energy legislation
to offer incentives for more natural gas production
and for increased energy assistance to aid indigent and
low-income customers.
CONTROLLING KEY EXPENSES
To control our purchased gas costs, we use a combination
of gas storage, fixed physical contracts and fixed financial
contracts. We have fixed the price for about 50 percent of
our expected 2004–2005 winter gas supply requirements.
Of the total amount hedged, about
45 percent is a combination of our
underground storage assets and con-
tracted pipeline storage; this storage
provides a natural hedge for our gas
supply purchases. The other 55 per-
cent of the quantity hedged is through
financial contracts.
Hedging is good financial management because it
protects our capital and cash flow. It also cushions the
effects of higher gas prices on our customers’ winter bills,
on our receivables and, ultimately, on our collections.
Despite rising natural gas prices, we have contin-
ued to keep our utility bad-debt expense low. Our
collection efforts, coupled with credit qualification before
reconnecting customers and expanded customer
payment options, helped us maintain our allowance for
doubtful accounts in 2004 at just 0.29 percent of
residential and commercial revenues, which is consider-
ably lower than our historical accrual rate.
OPERATING EFFICIENCY
Atmos Energy has earned a reputation for being one of
the most efficient natural gas utilities in the country.
We continue to be an industry leader in two key indicators:
operation and maintenance expense per customer and
customers served per employee.
We benchmark our performance each year against
our industry peer group. Since 1997,
we have reduced operating costs and
expenses by about $57 per customer,
or 31 percent. For fiscal 2004, our O&M-
per-customer expense was $126,
compared to our peer group’s average
of $193, which is 53 percent higher
than ours. We served 566 customers per
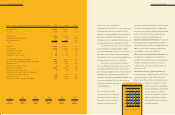
O&M EXPENSES
$140
$130
$120
$110
$100
Operation and maintenance
expense per customer
2000 2001 2002 2003 2004
20 OPERATIONS REVIEW