Atmos Energy 2004 Annual Report Download - page 13
Download and view the complete annual report
Please find page 13 of the 2004 Atmos Energy annual report below. You can navigate through the pages in the report by either clicking on the pages listed below, or by using the keyword search tool below to find specific information within the annual report.-
 1
1 -
2
-
 3
3 -
 4
4 -
 5
5 -
 6
6 -
 7
7 -
 8
8 -
 9
9 -
 10
10 -
 11
11 -
 12
12 -
 13
13 -
 14
14 -
 15
15 -
 16
16 -
 17
17 -
 18
18 -
 19
19 -
 20
20 -
 21
21
 |
 |

OPERATIONS REVIEW 21
employee, compared to the industry peer group’s average
of 546 customers.
Our control of operating expenses is even more
remarkable, considering that we have operated primarily
in rural and smaller communities across 12 states. The
structure of our operations has made it more difficult to
achieve efficiencies, compared with a company serving
a large customer base in a metropolitan area or limited
geographical area.
CUSTOMER SATISFACTION
Customer service excellence is one of our major goals.
The most recent independent survey of our customers’
attitudes, conducted in the fall of 2004, found an overall
satisfaction rating among residential and commercial
customers of 94 percent. Compared with other utility
service providers, Atmos Energy ranked among the
industry’s leaders in overall satisfaction.
NONUTILITY OPERATIONS
Our nonutility operations during 2004 achieved major
improvements in margins and in reduced exposure to
risks from volatile gas commodity prices. Our natural gas
marketing business expanded into the Mobile Bay area
of Alabama. In Kansas, nonutility gas storage facilities
were transferred to our Colorado-Kansas Division for
utility operations.
A major development was the acquisition of
the natural gas pipeline and storage assets of TXU Gas.
Although regulated, these assets will be managed
under our nonutility operations.
The 6,162-mile pipeline extends across Texas to
transport natural gas to third parties. It has extensive
connections in nine major gas-producing basins and three
interconnection hubs to other major producing areas
and many interstate pipelines. Five underground gas storage
reservoirs contain 39 Bcf of working storage, including
one salt-dome facility with higher delivery capabilities.
We believe this pipeline and storage system is
well situated to transport larger volumes of natural gas.
Its operations create additional gas marketing and
other opportunities for our nonutility businesses.
FISCAL 2005 FORECAST
We anticipate our earnings will increase at 3 percent to
6 percent a year, on average, during the next five years. We
also expect to continue paying higher annual dividends.
In fiscal 2005, we expect to earn between $1.65
and $1.75 per diluted share and to pay an indicated
dividend rate of $1.24 per share. Our capital expenditures
are expected to approximate $340 million to $350
million, with about 60 percent of that total being spent
on projects in our new Mid-Tex Division.
remain abundant in North America, gas production has
not kept pace with the steady rise in demand.
During the 2004–2005 heating season, residential
heating bills will likely increase 10 percent to 15 percent
above bills of the previous heating season, according to the
federal Energy Information Administration. Tight sup-
plies also are causing greater volatility in natural gas prices.
To help protect our customers, we offer budget
billing plans, assistance for low-income customers and
information about lowering energy costs. We also
have advocated vigorously for federal energy legislation
to offer incentives for more natural gas production
and for increased energy assistance to aid indigent and
low-income customers.
CONTROLLING KEY EXPENSES
To control our purchased gas costs, we use a combination
of gas storage, fixed physical contracts and fixed financial
contracts. We have fixed the price for about 50 percent of
our expected 2004–2005 winter gas supply requirements.
Of the total amount hedged, about
45 percent is a combination of our
underground storage assets and con-
tracted pipeline storage; this storage
provides a natural hedge for our gas
supply purchases. The other 55 per-
cent of the quantity hedged is through
financial contracts.
Hedging is good financial management because it
protects our capital and cash flow. It also cushions the
effects of higher gas prices on our customers’ winter bills,
on our receivables and, ultimately, on our collections.
Despite rising natural gas prices, we have contin-
ued to keep our utility bad-debt expense low. Our
collection efforts, coupled with credit qualification before
reconnecting customers and expanded customer
payment options, helped us maintain our allowance for
doubtful accounts in 2004 at just 0.29 percent of
residential and commercial revenues, which is consider-
ably lower than our historical accrual rate.
OPERATING EFFICIENCY
Atmos Energy has earned a reputation for being one of
the most efficient natural gas utilities in the country.
We continue to be an industry leader in two key indicators:
operation and maintenance expense per customer and
customers served per employee.
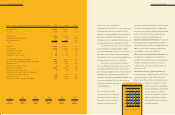
We benchmark our performance each year against
our industry peer group. Since 1997,
we have reduced operating costs and
expenses by about $57 per customer,
or 31 percent. For fiscal 2004, our O&M-
per-customer expense was $126,
compared to our peer group’s average
of $193, which is 53 percent higher
than ours. We served 566 customers per
O&M EXPENSES
$140
$130
$120
$110
$100
Operation and maintenance
expense per customer
2000 2001 2002 2003 2004
20 OPERATIONS REVIEW