Atmos Energy 1997 Annual Report Download - page 8
Download and view the complete annual report
Please find page 8 of the 1997 Atmos Energy annual report below. You can navigate through the pages in the report by either clicking on the pages listed below, or by using the keyword search tool below to find specific information within the annual report.-
 1
1 -
 2
2 -
 3
3 -
 4
4 -
 5
5 -
 6
6 -
 7
7 -
 8
8 -
 9
9 -
 10
10 -
 11
11 -
 12
12 -
 13
13 -
 14
14 -
 15
15 -
 16
16 -
 17
17 -
 18
18 -
 19
19 -
20
-
21
-
22
-
23
-
24
-
25
-
26
-
27
-
28
-
29
-
30
-
31
-
32
-
33
-
34
-
35
-
36
-
37
-
38
-
39
-
40
-
41
-
42
-
43
-
44
-
45
-
46
-
47
-
48
-
49
-
50
-
51
-
52
-
53
 |
 |

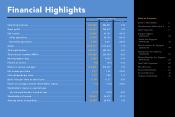
Financial Performance
In terms of performance measures for 1997, our total return to shareholders was 10.4 percent for 1997, assuming reinvest-
ment of dividends. Even more noteworthy, our five-year annual total return to shareholders has been 15.1 percent, and for
the 10 years has been 15.8 percent, among the best of our local distribution company peer group. The company’s market
capitalization increased to almost $737 million at fiscal year-end, up from $481 million at the end of fiscal 1996.
The Board of Directors increased the quarterly dividend to $.255 per share or $1.02 annually in August 1997, as agreed as
a part of the United Cities merger. The Board increased the quarterly dividend 4 percent to $.265 per share or $1.06 per
year in November 1997, a 6 percent increase since November 1996. This was our 10th consecutive annual dividend
increase. The dividend has increased by approximately 5 percent per year in the last five years.
For the fiscal year ended September 30, 1997, net income was $23.8 million or $.81 per share on operating revenues of
$906.8 million. The 1997 net income includes the effects of after-tax charges related to certain management changes ($2.8
million or $.10 per share) and reserves related to the United Cities merger and integration ($12.6 million or $.43 per share).
Excluding the effect of the charges and reserves, the company’s net income would have been $39.3 million or $1.34 per share
in 1997, compared to $41.2 million or $1.42 per share for 1996. The 1997 results include United Cities, and prior year
results have been restated to reflect the pooling of interests accounting that was used for the merger.
The decline in net income from 1996 to 1997, excluding the charges and reserves, was the result of warmer than
normal weather during the winter months, which negatively impacted gas throughput and sales as well as propane sales. In
addition, the spring months were wetter than normal, which adversely impacted sales of natural gas to farmers in West
Texas for irrigation. These negative effects of weather were partially offset by rate increases implemented in fiscal 1996
and 1997 in Texas, Kentucky, Georgia, Iowa, Virginia, Tennessee, Missouri and Illinois. Normal weather conditions would
have added about $.12 per share to the 1997 financial results.
The cost of the merger and integration totaled approximately $17 million for the transaction costs and $32 million for the separa-
tion and other costs. The company recorded these costs as regulatory assets in the fourth quarter of fiscal year 1997 when the merger
was completed, separation plans were approved by the Board of Directors and announcements were made to employees.
There are substantial longer term benefits to our customers and our shareholders from the merger of the two companies, which
the company expects to result in cost savings over the next 10 years totaling about $375 million. The company believes a
significant amount of the costs to achieve these benefits will be recovered through rates and future operating efficiencies of the
combined operations, and therefore, the company recorded the costs of the merger with and integration of United Cities as
regulatory assets. However, the company established a general reserve of approximately $20 million ($12.6 million after-tax) to
account for a portion of the costs that may be shared by our shareholders for their portion of the benefits.
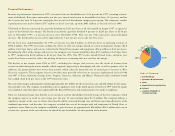
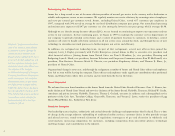
63.7%
20.5%
5.1%
5.0%
3.1% 2.6%
Uses of Revenue
purchased gas
operation & maintenance
taxes
depreciation & amortization
interest
common dividends &
retained earnings
3