Atmos Energy 1997 Annual Report Download - page 2
Download and view the complete annual report
Please find page 2 of the 1997 Atmos Energy annual report below. You can navigate through the pages in the report by either clicking on the pages listed below, or by using the keyword search tool below to find specific information within the annual report.-
 1
1 -
 2
2 -
 3
3 -
 4
4 -
 5
5 -
 6
6 -
 7
7 -
 8
8 -
 9
9 -
 10
10 -
 11
11 -
 12
12 -
 13
13 -
14
-
15
-
16
-
17
-
18
-
19
-
20
-
21
-
22
-
23
-
24
-
25
-
26
-
27
-
28
-
29
-
30
-
31
-
32
-
33
-
34
-
35
-
36
-
37
-
38
-
39
-
40
-
41
-
42
-
43
-
44
-
45
-
46
-
47
-
48
-
49
-
50
-
51
-
52
-
53
 |
 |

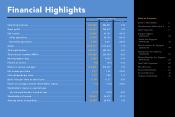
Table of Contents:
Letter to Shareholders . . . . . . . . . .2
Chief Executive Officer Q & A . . .6
Utility Operations . . . . . . . . . . . . .8
Energas Company
Information . . . . . . . . . . . . . . . .10
Greeley Gas Company
Information . . . . . . . . . . . . . . . .12
Trans Louisiana Gas Company
Information . . . . . . . . . . . . . . . .14
United Cities Gas Company
Information . . . . . . . . . . . . . . . .16
Western Kentucky Gas Company
Information . . . . . . . . . . . . . . . .18
Non-Utility Operations . . . . . . . . .20
Shared Services . . . . . . . . . . . . . . .22
Financial Information . . . . . . . . . .23
Board of Directors . . . . . . . . . . . .48
Corporate Information . . . . . . . . .49
YEAR ENDED SEPTEMBER 30,
1997 1996 % Change
____________________________________________________________________________________________________________________________________________________________________________________________________
Operating revenues......................................................................................... 906,835 886,691 2.3%
Gross profit ...................................................................................................... 329,654 324,412 1.6%
Net income ...................................................................................................... 23,838 41,151 -42.1%
Utility operations........................................................................................... 20,463 36,740 -44.3%
Non-utility operations ................................................................................... 3,375 4,411 -23.5%
Assets............................................................................................................... 1,088,311 1,010,610 7.7%
Total capitalization ........................................................................................... 630,241 605,744 4.0%
Total volumes handled (MMcf) ........................................................................ 213,008 222,439 -4.2%
Heating degree days ....................................................................................... 3,909 4,043 -3.3%
Percent of normal ............................................................................................ 98% 101% -3.0%
Meters in service (average) ............................................................................. 984,835 974,767 1.0%
Net income per share...................................................................................... 0.81 1.42 -43.0%
Cash dividends per share ................................................................................ 1.01 0.98 3.1%
Book value per share at end of year............................................................... 11.04 11.27 -2.0%
Return on average common shareholders’ equity.......................................... 7.3% 13.0% -43.8%
Shareholders’ equity as a percentage
of total capitalization at end of year ........................................................... 40.3% 43.9% -8.2%
Shareholders of record .................................................................................... 29,867 36,472 -18.1%
Average shares outstanding............................................................................ 29,409 28,978 1.5%
Financial Highlights