Anthem Blue Cross 2007 Annual Report Download - page 31
Download and view the complete annual report
Please find page 31 of the 2007 Anthem Blue Cross annual report below. You can navigate through the pages in the report by either clicking on the pages listed below, or by using the keyword search tool below to find specific information within the annual report.-
 1
1 -
2
-
3
-
4
-
5
-
6
-
7
-
8
-
9
-
10
-
11
-
12
-
13
-
14
-
15
-
16
-
17
-
18
-
19
-
20
-
 21
21 -
 22
22 -
 23
23 -
 24
24 -
 25
25 -
 26
26 -
 27
27 -
 28
28 -
 29
29 -
 30
30 -
 31
31 -
 32
32 -
 33
33 -
 34
34 -
 35
35 -
 36
36
 |
 |

29
WellPoint, Inc. 2007 Summary Annual Report
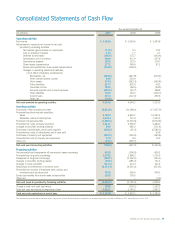
Year ended December 31
(In millions) 2007 2006 2005
Operating activities
Net income $ 3,345.4 $ 3,094.9 $ 2,463.8
Adjustments to reconcile net income to net cash
provided by operating activities:
Net realized (gains) losses on investments (11.2) 0.3 10.2
Loss on disposal of assets 11.3 1.7 2.7
Deferred income taxes (105.5) 273.7 (102.6)
Amortization, net of accretion 466.0 471.9 437.9
Depreciation expense 120.2 133.0 118.7
Share-based compensation 177.1 246.9 81.2
Excess tax benefits from share-based compensation (153.3) (136.5) —
Changes in operating assets and liabilities,
net of effect of business combinations:
Receivables, net (448.6) (627.8) (230.4)
Other invested assets, current 26.9 234.9 —
Other assets 174.4 (362.4) (165.6)
Policy liabilities 257.7 852.6 46.3
Unearned income 125.5 (69.5) (38.2)
Accounts payable and accrued expenses (235.2) (91.7) 188.6
Other liabilities 176.5 134.2 (136.7)
Income taxes 447.3 (112.0) 459.6
Other, net (29.9) — —
Net cash provided by operating activities 4,344.6 4,044.2 3,135.5
Investing activities
Purchases of fixed maturity securities (8,512.0) (11,198.0) (17,457.0)
Proceeds from fixed maturity securities:
Sales 6,709.0 9,630.1 14,391.4
Maturities, calls and redemptions 1,618.4 721.6 1,344.5
Purchase of equity securities (1,389.2) (2,434.5) (4,530.6)
Proceeds from sales of equity securities 1,411.7 2,950.9 4,480.0
Changes in securities lending collateral 50.6 485.2 (731.4)
Purchases of subsidiaries, net of cash acquired (298.5) (25.4) (2,589.7)
Proceeds from sales of subsidiaries, net of cash sold — — 92.8
Purchases of property and equipment (322.0) (193.9) (161.8)
Proceeds from sale of property and equipment 57.3 6.4 10.2
Other, net (94.2) (399.7) —
Net cash used in investing activities (768.9) (457.3) (5,151.6)
Financing activities
Net proceeds from (repayments of) commercial paper borrowings 502.8 (306.0) 808.2
Proceeds from long-term borrowings 1,978.3 2,668.2 1,700.0
Repayment of long-term borrowings (509.7) (2,162.1) (155.1)
Changes in securities lending payable (50.6) (485.2) 731.4
Changes in bank overdrafts (117.1) 414.3 121.2
Repurchase and retirement of common stock (6,151.4) (4,550.2) (333.4)
Proceeds from exercise of employee stock options and
employee stock purchase plan 784.5 559.5 429.3
Excess tax benefits from share-based compensation 153.3 136.5 —
Other, net — — (2.5)
Net cash (used in) provided by financing activities (3,409.9) (3,725.0) 3,299.1
Change in cash and cash equivalents 165.8 (138.1) 1,283.0
Cash and cash equivalents at beginning of year 2,602.1 2,740.2 1,457.2
Cash and cash equivalents at end of year $ 2,767.9 $ 2,602.1 $ 2,740.2
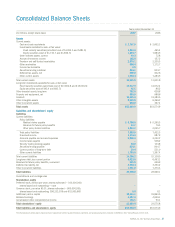
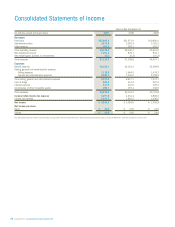
The information presented above should be read in conjunction with the audited nancial statements and accompanying notes included in WellPoint’s 2007 Annual Report on Form 10-K.
Consolidated Statements of Cash Flow