Anthem Blue Cross 2007 Annual Report Download - page 28
Download and view the complete annual report
Please find page 28 of the 2007 Anthem Blue Cross annual report below. You can navigate through the pages in the report by either clicking on the pages listed below, or by using the keyword search tool below to find specific information within the annual report.-
 1
1 -
2
-
3
-
4
-
5
-
6
-
7
-
8
-
9
-
10
-
11
-
12
-
13
-
14
-
15
-
16
-
17
-
 18
18 -
 19
19 -
 20
20 -
 21
21 -
 22
22 -
 23
23 -
 24
24 -
 25
25 -
 26
26 -
 27
27 -
 28
28 -
 29
29 -
 30
30 -
 31
31 -
 32
32 -
 33
33 -
 34
34 -
 35
35 -
 36
36
 |
 |

26 Customer First : : www.wellpoint.com/annualreport/2007
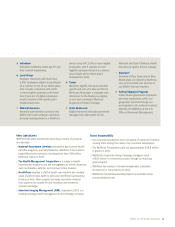
The information presented below is as reported in WellPoint’s 2007 Annual Report on Form 10-K. On December 28, 2005, WellPoint acquired
WellChoice, Inc. The acquisition was deemed effective December 31, 2005 for accounting purposes; accordingly, 2005 operating results and
earnings per share do not include WellChoice.
Years ended December 31
(dollars in millions, except per share data) 2007 2006 2005
Operating Results
Total operating revenue $60,122.0 $56,160.4 $43,991.2
Total revenue 61,134.3 57,038.8 44,614.1
Net income 3,345.4 3,094.9 2,463.8
Earnings Per Share
Basic net income $ 5.64 $ 4.93 $ 4.03
Diluted net income 5.56 4.82 3.94
Balance Sheet Information
Total assets $52,060.0 $51,574.9 $51,123.9
Total liabilities 29,069.6 26,999.1 26,130.8
Total shareholders’ equity 22,990.4 24,575.8 24,993.1
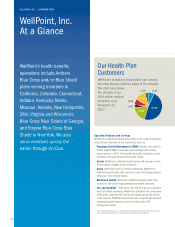
Medical Membership (000s)
Commercial and Consumer Business 30,005 29,669 29,347
Specialty, Senior and State Sponsored 3,424 3,075 3,164
Other 1,380 1,357 1,345
Total medical membership 34,809 34,101 33,856
Note 1 : : The information presented above should be read in conjunction with the audited consolidated nancial statements and accompanying notes and Management’s Discussion and Analysis of
Financial Condition and Results of Operations included in WellPoint’s 2007 Annual Report on Form 10-K.
Note 2 : : Certain prior year amounts have been reclassi ed to conform to current year presentation.
Financial Highlights
2005 2006 2007
$44.6
$57.0
$61.1
TOTAL REVENUE
(in billions)
TOTAL MEDICAL
MEMBERSHIP
(in millions)
SELLING, GENERAL
AND ADMINISTRATIVE
EXPENSE RATIO
33.9
34.8
2005 2006 2007
34.1 15.7%
16.5%
2005 2006 2007
14.5%