Alpine 2008 Annual Report Download - page 15
Download and view the complete annual report
Please find page 15 of the 2008 Alpine annual report below. You can navigate through the pages in the report by either clicking on the pages listed below, or by using the keyword search tool below to find specific information within the annual report.-
 1
1 -
2
-
3
-
4
-
 5
5 -
 6
6 -
 7
7 -
 8
8 -
 9
9 -
 10
10 -
 11
11 -
 12
12 -
 13
13 -
 14
14 -
 15
15 -
 16
16 -
 17
17 -
 18
18 -
 19
19 -
 20
20 -
 21
21 -
 22
22 -
 23
23 -
 24
24 -
 25
25 -
26
-
27
-
28
-
29
-
30
-
31
-
32
-
33
-
34
-
35
-
36
-
37
-
38
-
39
-
40
 |
 |

15
offset shifts in new car demand toward smaller models, leading to a decline in sales.
As a result, sales of this segment decreased 4.9% compared with the previous fiscal year.
Overall, for consolidated performance during the fiscal year under review, net sales decreased
4.9% to ¥252,072 million (US$2,515.9 million), operating income fell 30.6% to ¥7,012 million
(US$70.0 million), and net income decreased 38.0% to ¥3,554 million (US$35.5 million). Net
income per share was ¥50.95 (US$0.51).
The number of consolidated subsidiaries changed to 27 companies, with 8 companies in
Japan and 19 overseas. The number of companies accounted for by the equity method at the
end of the fiscal year remained 1.
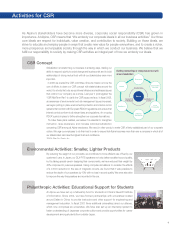
Investment
Capital expenditures increased 8.3% to ¥13,673 million (US$136.5 million). By segment,
investment in the Audio Products business totaled ¥8,068 million (US$80.5 million), and that in
the Information and Communication Equipment business amounted to ¥5,452 million (US$54.4
million).
R&D expenses decreased 3.3% to ¥29,337 million (US$292.8 million). R&D expenses
amounted to 11.6% of net sales, up 0.2 percentage points.
Cash Flows
For the fiscal year under review, cash and cash equivalents at the end of the period totaled
¥30,159 million (US$301.0 million), a decrease of ¥7,348 million (US$73.3 million), or 19.6%,
compared with the previous fiscal year-end.
Cash flows from operating activities
Net cash provided by operating activities amounted to ¥9,963 million (US$99.4 million), a
decrease of 39.2%. This was mainly the result of inflows provided by net income before taxes
and other adjustments of ¥6,345 million (US$63.3 million), depreciation and amortization of
¥10,655 million (US$106.3 million) and decrease in notes and accounts receivable of ¥5,779
million (US$57.7 million), decrease in notes and accounts payable of ¥1,624 million (US$16.2
million), and income taxes paid of ¥5,275 million (US$52.6 million) from the payment of income
and other taxes.
Cash flows from investing activities
Net cash used in investing activities was ¥14,101 million (US$140.7 million), up 18.6%
compared with the previous fiscal year. Principal components were payments for the
acquisition of tangible and intangible fixed assets of ¥11,029 million (US$110.1 million) and
¥2,945 million (US$29.4 million), respectively.
Cash flows from financing activities
Net cash used in financing activities totaled ¥2,290 million (US$22.9 million), up 48.6%. The
principal component was cash dividends paid of ¥1,744 million (US$17.4 million).
Financial Position
Total assets at the end of the year decreased 7.4% to ¥167,785 million (US$1,674.7 million),
primarily due to a decrease in cash and cash equivalents, notes and accounts receivable, and
investment in securities. As a result of the decrease in unrealized holding gains on securities
and foreign currency translation adjustment, total net assets shrank 3.8% to ¥116,265 million
(US$1,160.4 million). The equity ratio rose 2.7 percentage points to 68.5%.
Return on equity was 3.0%, a decrease of 1.9 of a percentage point. Return on assets was
2.0%, a decrease of 1.2 of a percentage point.
(Millions of yen)
2004
3,032
2005
10,491
2006
12,472
3,021
2007
12,887
3,229
2008
16,399
4,512
Cash Flows from Operating Activity
Free Cash Flow
(%)
2004
3.8
2005
9.4
2006
9.4
4.9
2007
6.2
5.3
2008
5.0
3.3
Return on Equity
Ruturn on Assets
(¥)
2004
17.5
2005 2006
20.0 20.0
2007 2008
25.0