Alpine 2008 Annual Report Download - page 12
Download and view the complete annual report
Please find page 12 of the 2008 Alpine annual report below. You can navigate through the pages in the report by either clicking on the pages listed below, or by using the keyword search tool below to find specific information within the annual report.-
 1
1 -
 2
2 -
 3
3 -
 4
4 -
 5
5 -
 6
6 -
 7
7 -
 8
8 -
 9
9 -
 10
10 -
 11
11 -
 12
12 -
 13
13 -
 14
14 -
 15
15 -
 16
16 -
 17
17 -
 18
18 -
 19
19 -
 20
20 -
 21
21 -
 22
22 -
23
-
24
-
25
-
26
-
27
-
28
-
29
-
30
-
31
-
32
-
33
-
34
-
35
-
36
-
37
-
38
-
39
-
40
 |
 |

12
1998 1999 2000 2001 2002 2003 2004 2005 2006 2007 2008 2008
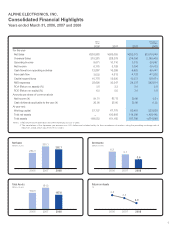
Net sales 168,146 176,311 171,084 181,615 196,092 222,367 213,020 222,779 253,983 265,055 252,072 2,515,940
(Overseas Sales) 105,968 122,220 123,893 129,522 157,032 177,017 170,984 180,828 215,281 228,379 219,056 2,186,406
Operating income 5,939 7,453 6,298 4,445 7,022 12,306 11,320 10,148 9,671 10,110 7,012 69,987
Net income 2,680 2,650 3,098 3,284 3,914 6,138 7,253 7,932 6,175 5,729 3,554 35,473
Cash flows from operating activities 2,273 13,142 4,622 1,921 15,728 14,389 10,491 12,472 12,887 16,399 9,963 99,441
Free cash flow (1,267) 7,107 3,100 (3,602) 8,513 6,290 3,021 3,229 3,032 4,512 (4,138) (41,302)
Depreciation 4,725 5,351 5,338 5,385 5,552 5,723 6,496 7,332 8,616 9,326 10,655 106,348
Capital expenditures 6,841 5,008 5,607 6,307 6,808 8,218 8,940 10,402 10,778 12,620 13,673 136,471
R&D expenses 8,770 10,781 10,990 12,628 14,718 17,644 19,144 22,438 28,695 30,347 29,337 292,814
ROA (Return on assets) (%) 2.4 2.3 2.6 2.7 2.8 4.1 4.9 5.3 3.8 3.3 2.0 2.0
ROE (Return on equity) (%) 5.7 5.4 5.9 5.4 5.6 8.3 9.4 9.4 6.2 5.0 3.0 3.0
Net income (¥) 48.52 47.96 54.74 56.40 64.49 99.78 117.94 128.97 91.71 82.12 50.95 0.51
Diluted net income (¥) 45.32 44.98 52.04 54.60 — 86.86 102.85 112.58 88.35 — — —
Cash dividends applicable to
the year (¥) 10.00 10.00 10.00 10.00 12.50 17.50 17.50 20.00 20.00 25.00 25.00 0.25
Stockholders’ equity (¥) 878.15 914.18 957.30 1,106.38 1,194.19 1,227.79 1,319.41 1,446.99 1,587.05 1,706.54 1,646.38 16.43
Current assets 74,879 80,165 81,400 85,046 102,396 106,180 99,031 105,372 109,910 114,938 103,756 1,035,592
Property, plant and equipment, net 24,348 23,022 22,810 23,649 22,466 22,898 22,714 25,544 27,647 30,090 32,851 327,887
Current liabilities 49,668 54,281 56,092 53,094 55,754 58,669 48,681 50,826 52,173 53,763 48,265 481,735
Long-term liabilities 10,436 12,420 6,005 6,403 17,944 15,869 15,534 15,807 5,004 6,514 3,255 32,488
Common stock 16,900 16,904 18,090 19,928 19,928 20,012 20,026 20,360 25,921 25,921 25,921 258,718
Retained earnings 15,731 17,721 23,365 26,002 29,247 34,393 40,500 47,275 52,213 57,344 58,592 584,809
Total stockholders’ equity 48,521 49,879 54,940 67,145 72,467 74,738 80,336 88,830 110,782 — — —
Total net assets — — — — — — — — — 120,908 116,265 1,160,445
Total assets 111,034 117,613 118,101 127,772 147,412 150,230 145,127 156,507 169,553 181,185 167,785 1,674,668
Equity ratio (%) 43.7 42.7 46.5 52.6 49.2 49.8 55.4 56.7 65.3 65.7 68.5 68.5
Notes: 1. R&D expenses include labor and other expenses reported as cost of sales.
2. Total stockholders’ equity and total assets for 2000 are reclassified to conform to the "Standard for Accounting for Transactions by Foreign Currency,
etc." effective from the year ended March 31, 2001. Accordingly, ROA and ROE for 2000 are recalculated. With the standard adopted prior to 2001,
total stockholders’ equity, total assets and stockholders’ equity per share of common stock for 2000 were ¥58,533 million, ¥121,694 million and
¥1,019.91, respectively. Also, ROA, ROE and equity ratio for 2000 were 2.6%, 5.7% and 48.1%, respectively.
3. Effective from the year ended March 31, 2007, the Company and its consolidated subsidiaries adopted the new accounting standard for presentation
of net assets ("Accounting Standard for Presentation of Net Assets in the Balance Sheet and its Implementation Guidance" issued by the Business
Accounting Deliberation Council on December 9, 2005).
Financial Highlights