Aetna 2009 Annual Report Download - page 14
Download and view the complete annual report
Please find page 14 of the 2009 Aetna annual report below. You can navigate through the pages in the report by either clicking on the pages listed below, or by using the keyword search tool below to find specific information within the annual report.-
 1
1 -
2
-
3
-
 4
4 -
 5
5 -
 6
6 -
 7
7 -
 8
8 -
 9
9 -
 10
10 -
 11
11 -
 12
12 -
 13
13 -
 14
14 -
 15
15 -
 16
16 -
 17
17 -
 18
18 -
 19
19 -
 20
20 -
 21
21 -
 22
22 -
 23
23 -
 24
24 -
25
-
26
-
27
-
28
-
29
-
30
-
31
-
32
-
33
-
34
-
35
-
36
-
37
-
38
-
39
-
40
-
41
-
42
-
43
-
44
-
45
-
46
-
47
-
48
-
49
-
50
-
51
-
52
-
53
-
54
-
55
-
56
-
57
-
58
-
59
-
60
-
61
-
62
-
63
-
64
-
65
-
66
-
67
-
68
-
69
-
70
-
71
-
72
-
73
-
74
-
75
-
76
-
77
-
78
-
79
-
80
-
81
-
82
-
83
-
84
-
85
-
86
-
87
-
88
-
89
-
90
-
91
-
92
-
93
-
94
-
95
-
96
-
97
-
98
-
99
-
100
 |
 |

Total pharmacy membership decreased in 2009 compared to 2008 primarily due to lower cross-selling of our
Commercial pharmacy benefit management services.
GROUP INSURANCE
Group Insurance primarily includes group life insurance products offered on an Insured basis, including basic and
supplemental group term life insurance, group universal life, supplemental or voluntary programs, and accidental death
and dismemberment coverage. Group Insurance also includes (i) group disability products offered to employers on
both an Insured and an ASC basis, which consist primarily of short-term and long-term disability insurance (and
products which combine both), (ii) absence management services offered to employers, which include short-term and
long-term disability administration and leave management, and (iii) long-term care products that were offered primarily
on an Insured basis, which provide benefits covering the cost of care in private home settings, adult day care, assisted
living or nursing facilities. We no longer solicit or accept new long-term care customers, and we are working with our
customers on an orderly transition of this product to other carriers.
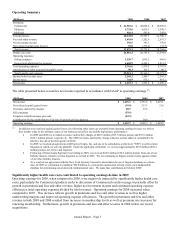
Operating Summary
(Millions) 2009 2008 2007
Premiums:
Life 1,093.0$ 1,062.7$ 1,201.4$
Disability 559.4 534.6 478.8
Long-term care 67.8 86.3 93.8
Total premiums 1,720.2 1,683.6 1,774.0
Fees and other revenue 106.9 97.9 101.1
Net investment income 274.1 240.4 303.0
Net realized capital gains (losses) 41.8 (311.2) (38.6)
Total revenue 2,143.0 1,710.7 2,139.5
Current and future benefits 1,575.2 1,468.8 1,619.2
Operating expenses:
Selling expenses 93.2 94.4 94.3
General and administrative expenses 283.4 310.1 263.1
Total operating expenses 376.6 404.5 357.4
Amortization of other acquired intangible assets 6.9 6.9 6.9
Total benefits and expenses 1,958.7 1,880.2 1,983.5
Income (loss) before income taxes 184.3 (169.5) 156.0
Income taxes 38.7 (54.2) 36.5
Net income (loss) 145.6$ (115.3)$ 119.5$
The table presented below reconciles net income to operating earnings reported in accordance with GAAP:
(Millions) 2009 2008 2007
Net income (loss) 145.6$ (115.3)$ 119.5$
Net realized capital (gains) losses (41.8) 224.7 25.1
Allowance on reinsurance recoverable
(1)
- 27.4 -
Operating earnings 103.8$ 136.8$ 144.6$
(1) As a result of the liquidation proceedings of Lehman Re Ltd. ("Lehman Re"), a subsidiary of Lehman Brothers Holdings Inc.,
we recorded an allowance against our reinsurance recoverable from Lehman Re of $27.4 million ($42.2 million pretax) in
2008. This reinsurance is on a closed block of paid-up group whole life insurance business.
Operating earnings for 2009 decreased $33 million when compared to 2008, primarily reflecting lower disability
underwriting margins primarily due to increased reserves in our disability business partially offset by higher net
investment income. Operating earnings for 2008 decreased $8 million compared to 2007, reflecting lower net
investment income partially offset by a higher underwriting margin due to favorable disability and long-term care
results. The variances in net investment income in 2009 and 2008 were primarily due to income from alternative
investments in 2008.
Annual Report – Page 8
Our group benefit ratios were 91.6% for 2009, 87.2% for 2008 and 91.3% for 2007. The increase in our group benefit
ratio for 2009 compared to 2008 was primarily due to increased reserves for disability products caused by longer claim