Aetna 2009 Annual Report Download - page 12
Download and view the complete annual report
Please find page 12 of the 2009 Aetna annual report below. You can navigate through the pages in the report by either clicking on the pages listed below, or by using the keyword search tool below to find specific information within the annual report.-
 1
1 -
 2
2 -
 3
3 -
 4
4 -
 5
5 -
 6
6 -
 7
7 -
 8
8 -
 9
9 -
 10
10 -
 11
11 -
 12
12 -
 13
13 -
 14
14 -
 15
15 -
 16
16 -
 17
17 -
 18
18 -
 19
19 -
 20
20 -
 21
21 -
 22
22 -
23
-
24
-
25
-
26
-
27
-
28
-
29
-
30
-
31
-
32
-
33
-
34
-
35
-
36
-
37
-
38
-
39
-
40
-
41
-
42
-
43
-
44
-
45
-
46
-
47
-
48
-
49
-
50
-
51
-
52
-
53
-
54
-
55
-
56
-
57
-
58
-
59
-
60
-
61
-
62
-
63
-
64
-
65
-
66
-
67
-
68
-
69
-
70
-
71
-
72
-
73
-
74
-
75
-
76
-
77
-
78
-
79
-
80
-
81
-
82
-
83
-
84
-
85
-
86
-
87
-
88
-
89
-
90
-
91
-
92
-
93
-
94
-
95
-
96
-
97
-
98
-
99
-
100
 |
 |

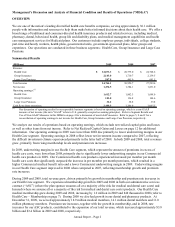
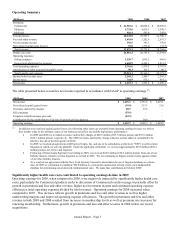
Although we became more efficient, based on our operating expenses as a percentage of revenue, our total operating
expenses increased in 2009 and 2008 over the prior years primarily due to the growth in our membership. Total
operating expenses increased due to higher general and administrative expenses as a result of higher employee-related
costs and other expenses associated with higher membership and higher selling expenses (reflecting an increase in
commissionable premiums and premium taxes both from membership growth).
We calculate our medical benefit ratio (“MBR”) by dividing health care costs by premiums. Our MBRs by product for
the years ended December 31, 2009, 2008 and 2007 were as follows:
2009 2008 2007
Commercial 84.5% 80.3% 79.5%
Medicare 87.1% 85.6% 86.8%
Medicaid 88.6% 87.4% 88.4%
Total 85.2% 81.5% 80.4%
Refer to the following discussion of Commercial, Medicare and Medicaid results for an explanation of the changes in
our MBR.
The operating results of our Commercial products reflect significantly lower underwriting margins in 2009.
Commercial premiums increased approximately $1.5 billion in 2009 compared to 2008, and increased approximately
$1.4 billion in 2008 compared to 2007. The increases in 2009 and 2008 reflect premium rate increases on renewing
business and higher membership levels.
Our Commercial MBRs were 84.5% for 2009, 80.3% for 2008 and 79.5% for 2007. The Commercial MBRs in 2009
and 2008 increased when compared to the prior year MBRs, reflecting a percentage increase in our per member health
care costs that outpaced the percentage increase in per member premiums. Included in the 2009 Commercial MBR is
approximately $97 million of unfavorable development of prior period health care cost estimates. This development
was related to unusually high paid claims activity for the first half of 2009, primarily related to claim activity in the
second half of 2008. The increase in per member health care costs in 2009 was driven primarily by higher facility
claim intensity, higher costs from H1N1 influenza, and higher costs from higher participation rates in health care
continuation coverage afforded to individuals under the Consolidated Omnibus Budget Reconciliation Act of 1986
(“COBRA”) (refer to our discussion of our Regulatory Environment beginning on page 22). The increase in per
member health care costs in 2008 was attributed to general inflationary increases caused by higher costs related to
physician services, laboratory services, emergency room and ancillary services as well as moderate increases in
hospital inpatient and outpatient costs.
We had no significant development of prior period health care cost estimates that affected results of operations in 2008
or 2007. The calculation of Health Care Costs Payable is a critical accounting estimate (refer to Critical Accounting
Estimates – Health Care Costs Payable beginning on page 16 for additional information).
Medicare results reflects growth in 2009 and 2008
Our Medicare Advantage contracts with the federal government are renewable for a one-year period on a calendar-year
basis. We expanded our Medicare Advantage HMO and PPO offerings into select additional markets in 2009 and now
offer Medicare Advantage HMO and PPO products in 246 counties in 22 states and Washington, D.C. We have been a
national provider of Medicare Part D Prescription Drug Plan (“PDP”) since 2006. In anticipation of changes in the
PFFS network requirements that will become effective in 2011, we decided to cease offering Medicare Advantage
plans in certain geographic areas in 2010. We sold mainly individual PFFS plans in these geographic areas.
Medicare premiums increased approximately $920 million in 2009, compared to 2008, and increased approximately
$2.2 billion in 2008 compared to 2007. The increase in 2009 and 2008 primarily reflects the introduction of our new
private fee-for-service (“PFFS”) product, which was effective January 1, 2007, including the conversion of a large
customer’ s membership from a Commercial ASC plan to a Medicare Insured plan in 2008. The increase in 2009 was
also due to increases in supplemental premiums across all of our Medicare Advantage products, rate
increases from the Centers for Medicare & Medicaid Services (“CMS”) and true-ups for specified risk adjustments
from CMS.
Annual Report – Page 6