Aetna 2009 Annual Report Download - page 11
Download and view the complete annual report
Please find page 11 of the 2009 Aetna annual report below. You can navigate through the pages in the report by either clicking on the pages listed below, or by using the keyword search tool below to find specific information within the annual report.-
 1
1 -
 2
2 -
 3
3 -
 4
4 -
 5
5 -
 6
6 -
 7
7 -
 8
8 -
 9
9 -
 10
10 -
 11
11 -
 12
12 -
 13
13 -
 14
14 -
 15
15 -
 16
16 -
 17
17 -
 18
18 -
 19
19 -
 20
20 -
 21
21 -
 22
22 -
23
-
24
-
25
-
26
-
27
-
28
-
29
-
30
-
31
-
32
-
33
-
34
-
35
-
36
-
37
-
38
-
39
-
40
-
41
-
42
-
43
-
44
-
45
-
46
-
47
-
48
-
49
-
50
-
51
-
52
-
53
-
54
-
55
-
56
-
57
-
58
-
59
-
60
-
61
-
62
-
63
-
64
-
65
-
66
-
67
-
68
-
69
-
70
-
71
-
72
-
73
-
74
-
75
-
76
-
77
-
78
-
79
-
80
-
81
-
82
-
83
-
84
-
85
-
86
-
87
-
88
-
89
-
90
-
91
-
92
-
93
-
94
-
95
-
96
-
97
-
98
-
99
-
100
 |
 |

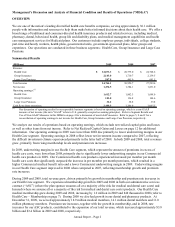
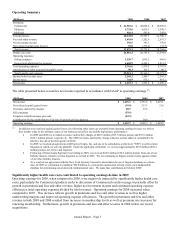
Operating Summary
(Millions) 2009 2008 2007
Premiums:
Commercial 21,581.6$ 20,096.2$ 18,656.8$
Medicare 5,735.8 4,816.1 2,598.3
Medicaid 926.4 595.0 245.0
Total premiums 28,243.8 25,507.3 21,500.1
Fees and other revenue 3,418.0 3,202.6 2,931.3
Net investment income 392.5 341.3 370.9
Net realized capital gains (losses) 19.0 (276.2) (33.7)
Total revenue 32,073.3 28,775.0 24,768.6
Health care costs 24,061.2 20,785.5 17,294.8
Operating expenses:
Selling expenses 1,158.7 1,055.2 966.6
General and administrative expenses 4,602.9 4,424.3 3,821.2
Total operating expenses 5,761.6 5,479.5 4,787.8
Amortization of other acquired intangible assets 90.3 101.3 90.7
Total benefits and expenses 29,913.1 26,366.3 22,173.3
Income before income taxes 2,160.2 2,408.7 2,595.3
Income taxes 744.9 875.1 919.2
Net income 1,415.3$ 1,533.6$ 1,676.1$
The table presented below reconciles net income reported in accordance with GAAP to operating earnings (1):
(Millions) 2009 2008 2007
Net income 1,415.3$ 1,533.6$ 1,676.1$
Net realized capital (gains) losses (19.0) 213.1 21.9
Severance and facility charges 60.9 35.6 -
ESI settlement (19.6) - -
Litigation-related insurance proceeds (24.9) - -
Contribution for the establishment of an out-of-network pricing database - 20.0 -
Operating earnings 1,412.7$ 1,802.3$ 1,698.0$
(1) In addition to net realized capital (gains) losses, the following other items are excluded from operating earnings because we believe
they neither relate to the ordinary course of our business nor reflect our underlying business performance:
In 2009 and 2008 we recorded severance and facility charges of $60.9 million ($93.7 million pretax) and $35.6 million
($54.7 million pretax), respectively. The 2009 severance and facility charge related to actions taken or committed to be
taken by the end of the first quarter of 2010.
In 2009, we reached an agreement with Express Scripts, Inc. and one of its subsidiaries (collectively "ESI") to settle certain
litigation in which we were the plaintiff. Under the applicable settlement, we received approximately $19.6 million ($30.2
million pretax), net of fees and expenses.
Following a Pennsylvania Supreme Court ruling in 2009, we received $24.9 million ($38.2 million pretax) from one of our
liability insurers related to certain litigation we settled in 2003. We are continuing to litigate similar claims against certain
of our other liability insurers.
As a result of our agreement with the New York Attorney General to discontinue the use of Ingenix databases at a future
date, in 2008 we committed to contribute $20.0 million to a non-profit organization to help create a new independent
database for determining out-of-network reimbursement rates. We made that contribution in October, 2009.
Significantly higher health care costs contributed to operating earnings decline in 2009
Operating earnings for 2009, when compared to 2008, were negatively impacted by significantly higher health care
costs, particularly for Commercial products (refer to discussion of Commercial results on page 6) partially offset by
growth in premiums and fees and other revenue, higher net investment income and continued operating expense
efficiencies (total operating expenses divided by total revenue). Operating earnings for 2008 increased when
compared to 2007. This increase reflects growth in premiums and fees and other revenue as well as higher
underwriting margins and improved operating expense efficiencies. The growth in premiums and fees and other
revenue in both 2009 and 2008 resulted from increases in membership levels as well as premium rate increases for
renewing membership. Furthermore, growth in premiums and fees and other revenue in 2008 reflect our recent
acquisitions.
Annual Report – Page 5