Aetna 2009 Annual Report Download - page 13
Download and view the complete annual report
Please find page 13 of the 2009 Aetna annual report below. You can navigate through the pages in the report by either clicking on the pages listed below, or by using the keyword search tool below to find specific information within the annual report.-
 1
1 -
2
-
 3
3 -
 4
4 -
 5
5 -
 6
6 -
 7
7 -
 8
8 -
 9
9 -
 10
10 -
 11
11 -
 12
12 -
 13
13 -
 14
14 -
 15
15 -
 16
16 -
 17
17 -
 18
18 -
 19
19 -
 20
20 -
 21
21 -
 22
22 -
 23
23 -
24
-
25
-
26
-
27
-
28
-
29
-
30
-
31
-
32
-
33
-
34
-
35
-
36
-
37
-
38
-
39
-
40
-
41
-
42
-
43
-
44
-
45
-
46
-
47
-
48
-
49
-
50
-
51
-
52
-
53
-
54
-
55
-
56
-
57
-
58
-
59
-
60
-
61
-
62
-
63
-
64
-
65
-
66
-
67
-
68
-
69
-
70
-
71
-
72
-
73
-
74
-
75
-
76
-
77
-
78
-
79
-
80
-
81
-
82
-
83
-
84
-
85
-
86
-
87
-
88
-
89
-
90
-
91
-
92
-
93
-
94
-
95
-
96
-
97
-
98
-
99
-
100
 |
 |

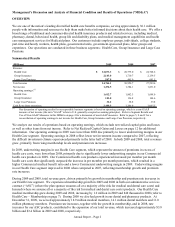
Our Medicare MBRs were 87.1% for 2009, 85.6% for 2008 and 86.8% for 2007. We had no significant development
of prior period health care cost estimates that affected results of operations in 2009, 2008 or 2007. The increase in our
Medicare MBR in 2009 reflects a percentage increase in our per member premiums that was outpaced by the
percentage increase in per member health care costs. The decrease in our Medicare MBR in 2008 reflected a
percentage increase in our per member premiums that outpaced the percentage increase in per member health care
costs.
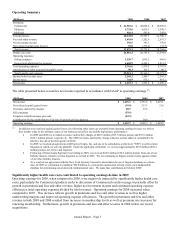
Other Sources of Revenue
Fees and other revenue for 2009 increased $215 million compared to 2008 reflecting growth in ASC membership as
described in the table below, partially offset by lower fee yields and revised product and service mix. The $271 million
increase in 2008 compared to 2007, reflected revenue from our acquisitions of Schaller Anderson Incorporated and
Goodhealth Worldwide (Bermuda) Limited as well as growth in ASC membership.
Net investment income for 2009 increased $51 million compared to 2008 primarily reflecting higher average asset
levels and higher yields on alternative investments. Net investment income for 2008 decreased $30 million compared
to 2007, primarily reflecting lower income from alternative investments.
Net realized capital gains (losses) for 2009 and 2007 were not significant. Net realized capital losses in 2008 were due
primarily to OTTI of debt securities (refer to our discussion of Investments – Net Realized Capital Gains and Losses on
page 12 for additional information) and net losses on the sale of debt securities.
Membership
Health Care’ s membership at December 31, 2009 and 2008 was as follows:
(Thousands) Insured ASC Total Insured ASC Total
Medical:
Commercial 5,614 11,821 17,435 5,595 10,893 16,488
Medicare 433 - 433 366 - 366
Medicaid 310 736 1,046 207 640 847
Total Medical Membership 6,357 12,557 18,914 6,168 11,533 17,701
Consumer-Directed Health Plans
(1)
1,868 1,431
Dental:
Commercial 4,998 7,304 12,302 5,012 7,494 12,506
Medicare and Medicaid 260 432 692 229 374 603
Network Access
(2)
- 1,067 1,067 - 1,015 1,015
Total Dental Membership 5,258 8,803 14,061 5,241 8,883 14,124
Pharmacy:
Commercial 9,728 9,846
Medicare PDP (stand-alone) 346 375
Medicare Advantage PDP 240 195
Medicaid 30 25
Total Pharmacy Benefit Management Services 10,344 10,441
Mail Order
(3)
669 657
Total Pharmacy Membership 11,013 11,098
2009 2008
(1) Represents members in consumer-directed health plans included in Commercial medical membership above.
(2) Represents members in products that allow these members access to our dental provider network for a nominal fee.
(3) Represents members who purchased medications through our mail order pharmacy operations during the fourth quarter of 2009 and
2008, respectively, and are included in pharmacy membership above.
Total medical membership at December 31, 2009 increased compared to December 31, 2008. The increase in medical
membership was primarily due to growth in Commercial membership, driven by growth within existing plan sponsors
and new customers, net of lapses, and Medicaid membership attributable to a new Insured contract.
Total dental membership at December 31, 2009 decreased compared to 2008 primarily due to the loss of a large
Government plan sponsor.
Annual Report – Page 7